Recently, Shoplus (TikTok analytics tool ) released a TikTok data report on the trends in the Vietnam market. Today, I will bring TikTok merchants to explore the market trends in Vietnam and learn how to use TikTok analytics tools to operate TikTok Shop more effectively.

Before analyzing the TikTok data report in Vietnam, we need to understand the characteristics of the Vietnamese region. The population structure in Vietnam is younger, with 50% of the population under the age of 35. It is a country with a relatively high internet penetration rate in Southeast Asia, and the usage rate of social media is 73.7% locally. There are also many internet celebrities in Vietnam, and over 70% of them are active on the TikTok platform. It is the country with the highest internet celebrity activity in Southeast Asia. Therefore, TikTok's live streaming and short videos have huge potential in the Vietnam market.
Steady increase in sales in the Vietnam market
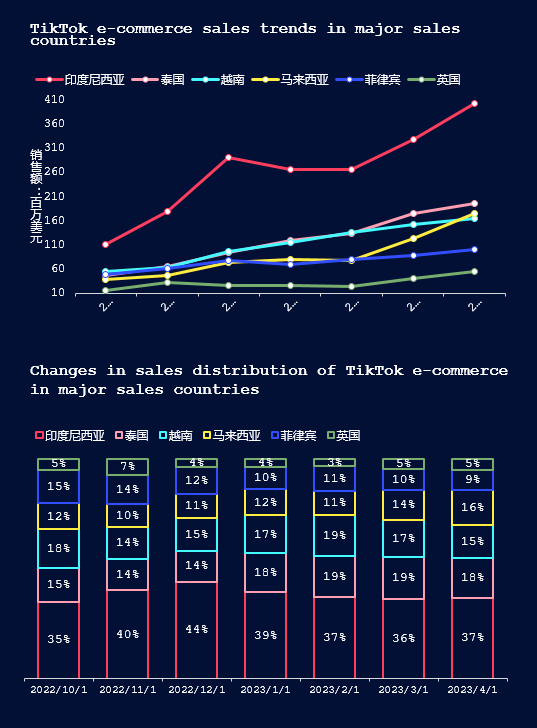
From the sales performance of TikTok e-commerce in various mainstream sales countries, Indonesia has a discontinuous advantage and ranks first with a market share of more than 35%. With the support of favorable factors such as Ramadan and Eid al-Fitr, Indonesia and Malaysia, which have a large number of Muslim populations, have seen a significant increase in sales in March and April 2023, with strong growth momentum.
Thailand and Vietnam have been stuck in a stalemate from October 2022 to February 2023, and Thailand only surpassed Vietnam in March 2023 to take the second place.

Women's clothing, beauty and personal care, and men's clothing are eternal hot-selling categories in the TikTok Vietnam market.
From the monthly sales ranking changes of various categories in the TikTok e-commerce Vietnam market, women's clothing and underwear, beauty and personal care, and men's clothing and underwear are eternal hot-selling categories, occupying the top three positions in monthly category sales in the TikTok Vietnam market. Food and beverage, maternal and child products, and health products have seen rapid growth in sales ranking, and are recent categories that have gained momentum.
The first best-selling price range for the main subcategories of women's clothing and underwear is a unit price of 4-8 US dollars, and the proportion of goods in this price range is over 40%, indicating a clear advantage. Due to factors such as cost and consumer expectations, the second best-selling price range for women's tops, dresses, suits, and jumpsuits differs slightly. The second best-selling price range for women's tops is a unit price of 0-4 US dollars, while the second best-selling price range for women's dresses, suits, and jumpsuits is 8-12 US dollars and 12-16 US dollars.
How to use TikTok analytics tracker to operate TikTok Shop better
1. Shoplus
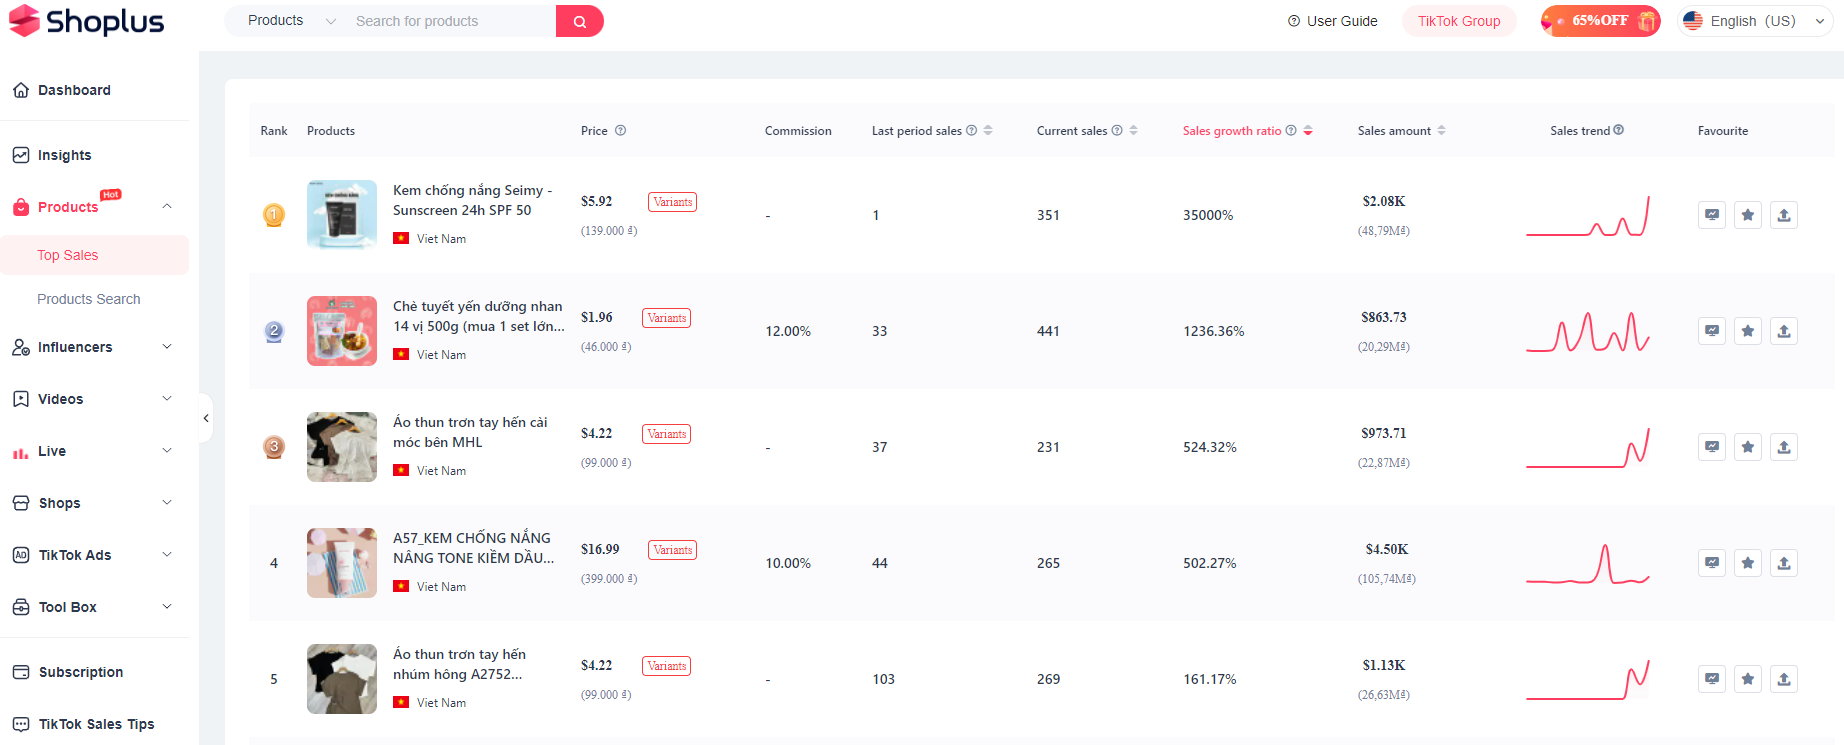
This is a TikTok analytics tool that focuses on TikTok data analysis, covering multiple dimensions of TikTok products, influencers, videos, advertisements, etc., and supports data export. It also uses its platform advantages and professional analysis to insight into TikTok national and regional market trends, and regularly compiles and publishes TikTok data reports to help TikTok merchants better understand market conditions and overall trends.

2. TikTok Analytics
This is a free tiktok analytics tool, which can analyze video views, interaction volume, and fan growth data, understand user interests and needs, and help merchants choose suitable products.

3. Google Trends
This tool can unlimitedly view the search volume of a certain keyword, helping merchants analyze which products have market advantages in which regions.

For TikTok cross-border e-commerce sellers, after grasping the big trends, accurate product selection is a more critical operational method. Sellers who have opened a Vietnamese store can use data platforms to learn more about data and anticipate market trends in advance. Wish you success!