Optimizing, iterating, and correcting actions based on data feedback is essential in most endeavors, as it often leads us closer to the essence of things. Data analysis is indispensable in operating a TikTok account as well, guiding us to a deeper understanding of TikTok and providing clear directions for iteration. This article will share some thoughts and methods on analyzing account and video data.
Two dimensions of Tiktok analysis
When conducting data analysis on TikTok, we usually categorize indicators into two types: "video indicators" and "account indicators."
Video indicators, as shown in the following chart, include views, like rate, comment rate, share rate, completion rate, total watch time, average watch time, video traffic sources, viewer distribution by region, and respective percentages.

What are the parameters for "account indicators"? As shown in the figure below, they include follow count, fan count, number of likes, fan-like ratio, number of videos posted, first post time, recent posting frequency, fan geographical distribution, and gender distribution.
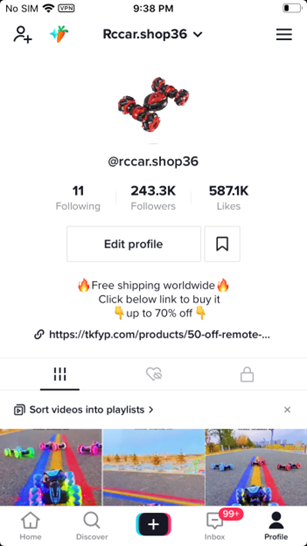
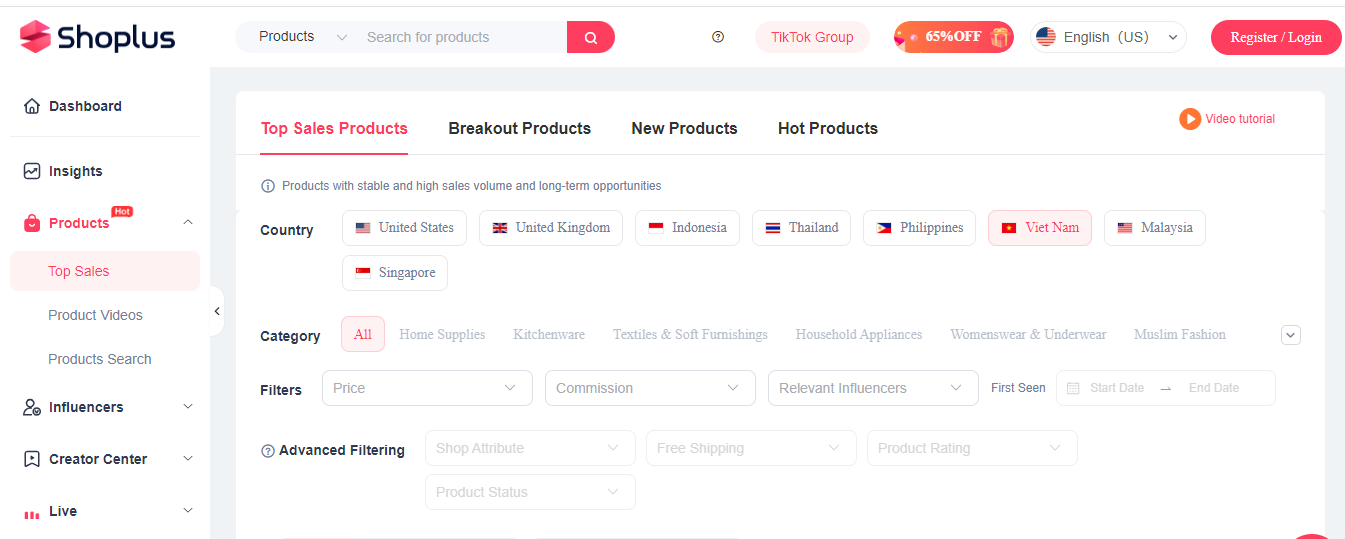
You can access this data directly on Tik Tok, or you can use more visual data analysis tools like Shoplus. Using Shoplus, the best TikTok analytics tool, you can dig deeper into TikTok's product data, such as views, likes, comments, shares, and sales, to objectively understand user preferences and demands.
About Video indicators
Firstly, we analyze the indicators of video dimensions, and analyze one by one which important indicators reflect what issues, the measurement standard of indicators should be in what range, and how to optimize the video through these indicators.
However, it is worth noting that different purposes, types, and categories of videos will have different data forms. For example, some videos have high likes, some videos have high comment interaction rates, and some videos focus on sharing and spreading. The recommended measurement standards provided below are generally applicable to most categories, but remember to be flexible when referring to them.
The first indicator: Completion Rate, which refers to the percentage of viewers who complete 100% of the viewing progress out of all viewers.
The completion rate is one of the most important indicators among a variety of video indicators, which is a key factor influencing the number of video views. For an app, how long customers are willing to spend time in the app is a critical indicator. Therefore, the completion rate is closely related to the time customers spend on it.
If the completion rate of your videos is high, it means that the audience is interested in the content of the videos and willing to spend time watching them, so the platform tends to consider these videos as relatively high-quality ones, further promoting them.
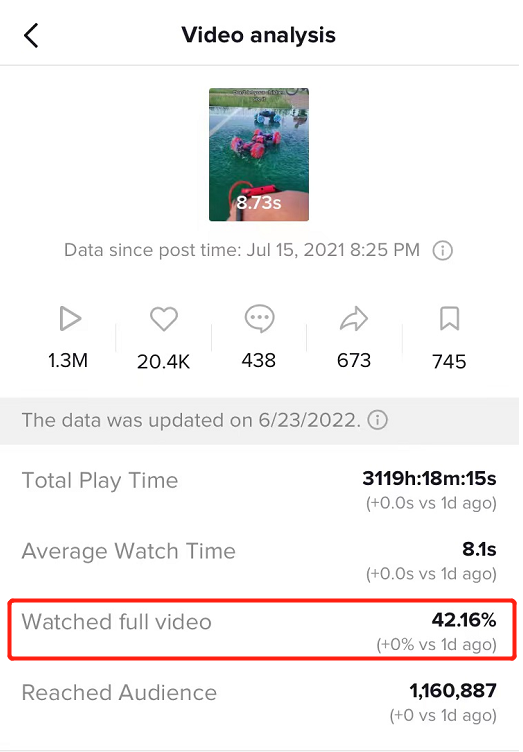
Let's think from the perspective of users, under what circumstances would they not want to watch the video in full and swipe away directly? There are several reasons:
1. The first three seconds of the video are not attractive enough. The loss of video audience is often the highest in the first three seconds, so we can examine whether the content in the first three seconds of the video is not attractive enough and if there is room for optimization.
2. Revealing all the content in the first three seconds. Many creators are well aware that the first three seconds of the video must be eye-catching, so they cram the main and exciting content of the video all in the first three seconds, leading to the audience having no expectations for the upcoming content. When the audience has no expectations, they naturally choose to swipe away. Therefore, in the process of creating many videos, opening the box, assembling, and other ways to raise expectations are also excellent choices.
3. The pace is sluggish. Audiences on the TikTok platform have limited patience for each video. If the video's pace is not tight and fails to fully capture the reader's senses, it can lead to audience loss. Especially for medium to long videos, it is even more important to maintain the video's pace and content density, making the audience feel that every second spent on this video is highly worthwhile.
Second indicator: Like rate. Calculation method: Like rate = total likes / total views.
Like rate, compared to completion rate mentioned above, does not have as significant impact on total views. However, it is still an important indicator with optimization value.
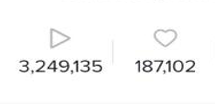
Likewise, let's consider from the audience's perspective, under what circumstances are viewers willing to give a video a thumbs up? There are generally two situations:
1. The video has value for saving. I believe many people have had the experience of coming across a pretty good video while browsing TikTok, but did not like or save it. Suddenly, one day when they want to find that video again, it is very difficult, even impossible, to find it through keyword search. Therefore, if we want to increase the like rate of a video, we can enhance its value, making viewers willing to like it, save it, and watch it repeatedly.
2. The video's point of interest. Having engaging content that can spark viewers' interests is a very important factor in influencing the like rate of a video, so if the video has a low like count, in the subsequent optimization process, it is essential to focus on how to increase the video's appeal.
The third indicator: comment rate. Calculation method: Comment rate = Total number of comments / Total playback volume.
If our comment rate is low, how should we optimize it? Here are 2 recommendations:
1. Strengthen interactive guidance. When guiding comments and interactions in videos, asking questions is a common and effective way, such as: Choose A or B? How many XX in the video?
2. Strengthen emotional resonance. Many scenic videos, emotional videos, and narrative videos have a more soothing pace, appearing seemingly calm but actually using emotional value. The transmission of short video content is often the transmission of emotions. Therefore, when designing video content, consider the emotions needed by the target audience. For example, many male-targeted inspirational bloggers tell stories about the hardships of men on social platforms, while inspirational female bloggers tell stories about the difficulties faced by women. This is about incorporating emotional value based on the target audience.
About account indicators
In terms of account dimension, the first key indicator we should focus on is the fan-like ratio, calculated as follows: fan-like ratio = total number of followers/ total number of likes. The fan-like ratio can intuitively reflect the stickiness of an account's followers. If the fan-like ratio is too low, it indicates that the account's follower stickiness is low, with the content attracting viewers only on a video level, rather than transcending to the blogger's persona or the account level.
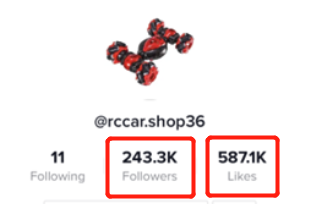
From an optimization perspective, there are two main points to consider:
1. Content consistency. The consistency of account content is crucial for enhancing fan stickiness, representing the sense of certainty that the account conveys to fans. For example, if we operate an account for toy cars, fans will have an expectation that the content will all be related to toy cars. This sense of certainty plays an important role in enhancing fan stickiness.
2. Continuous updates. Continuous updates are essential for increasing fan stickiness. The internet, especially TikTok, has a very limited memory for viewers. If we cannot maintain a high frequency of updates, fans will quickly forget about us, and as a result, fan stickiness will decrease. Therefore, in the process of operating TikTok accounts, we should strive to update daily.
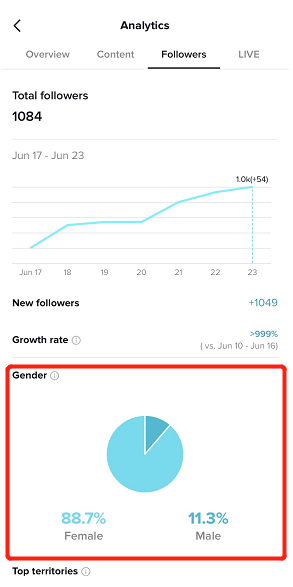
The second indicator is the distribution of fans. Fan distribution is commonly categorized by gender and location.
For gender distribution, we typically consider an account to be gender-specific if one gender accounts for more than 70% of the followers. For example, accounts focusing on nail art are usually targeted towards females, while accounts related to car accessories are often aimed at males. In these cases, the single-gender ratio should be at least 70% to indicate that the account's fans are targeted accurately.
In terms of regional distribution, our criteria for judgment is that the proportion of fans in the main target country should be greater than 20%. If our target country is the United States, the percentage of fans in the United States should be greater than 20%. If the target country is France, the percentage of fans in the France region should be greater than 20%. If the percentage is lower than 20%, we consider the fans to be inaccurate and in need of significant optimization.
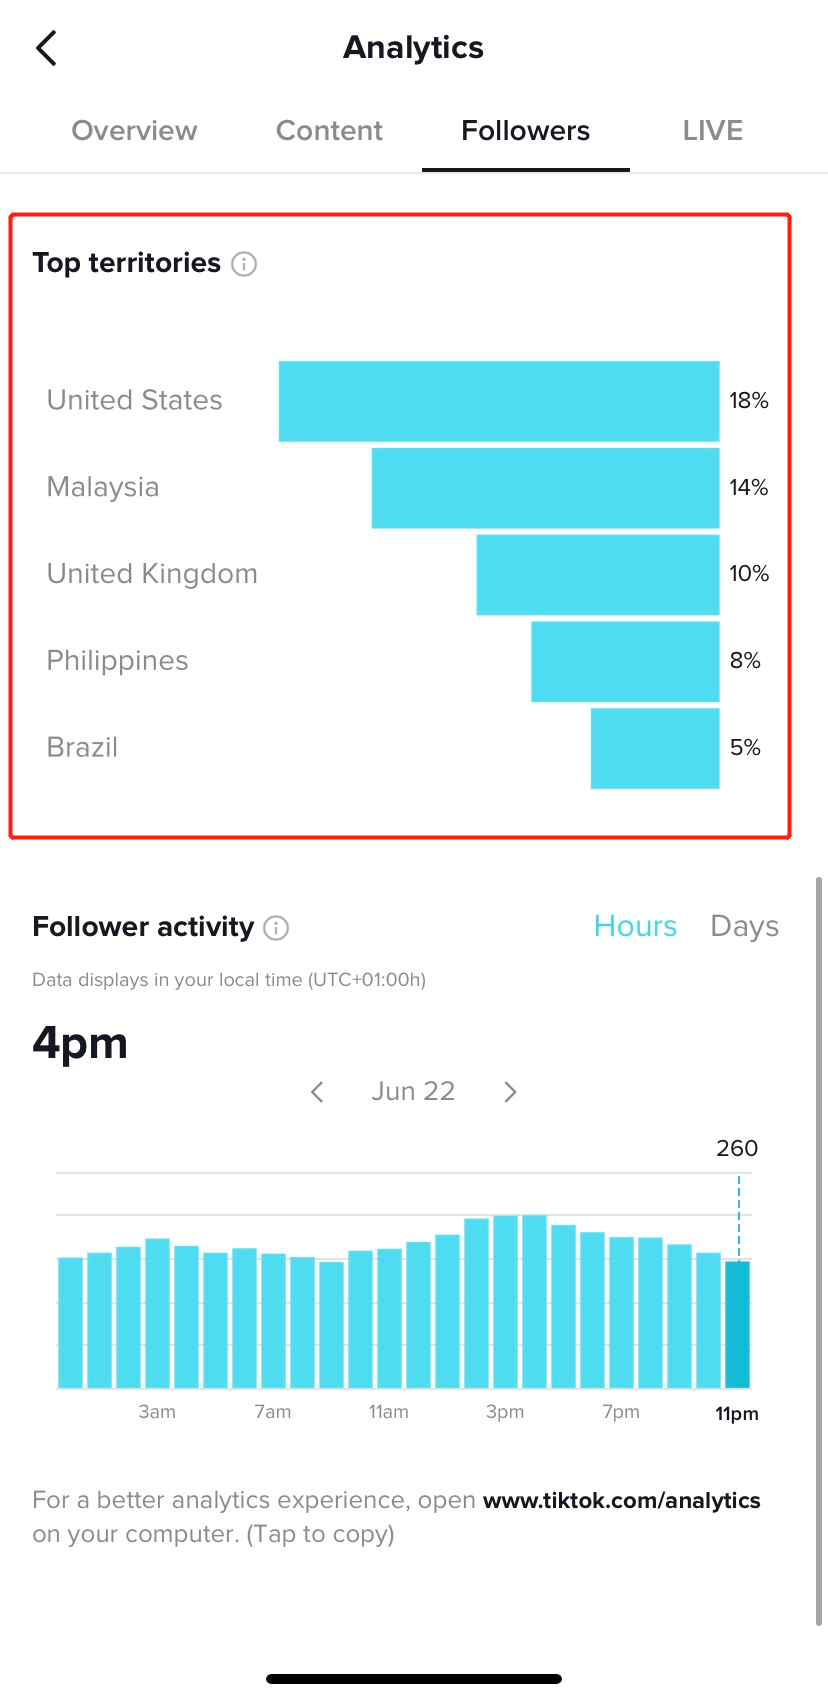
The audience of the account shows a clear regional trend, which makes it easier for merchants to pay attention to the characteristics of the region when selecting products. Using Shoplus later, they can easily find popular products suitable for the tone of the account.
Conclusion
In summary, analyzing TikTok data is essential for optimizing account performance. By focusing on key video and account indicators, such as completion rate, like rate, fan-like ratio, and fan distribution, we can identify areas for improvement and enhance audience engagement.