In the ever-evolving landscape of social media, TikTok has emerged as a powerhouse platform, captivating millions of users worldwide with its short-form videos. For content creators looking to harness the full potential of TikTok, understanding and leveraging the platform's analytics is crucial. This blog will delve into the intricacies of TikTok Analytics, offering a detailed guide on how to read and interpret these metrics to optimize your content strategy, enhance engagement, and accelerate growth.
Setting Up TikTok Analytics
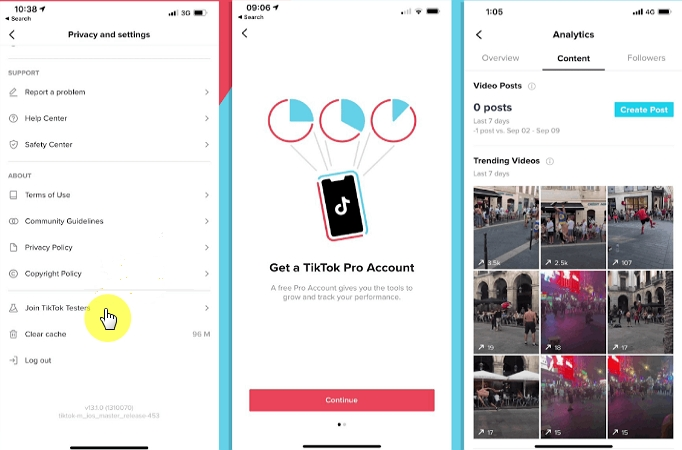
To access TikTok's in-depth analytics, you need to switch to a Pro account. This type of account offers additional features, including detailed analytics, access to the Creator Marketplace, and eligibility for the Creator Fund.
Creating a Pro Account

To switch to a Pro account, follow these steps:
1. Open TikTok: Go to your profile page.
2. Settings: Click on the three dots at the top right corner.
3. Manage Account: Select “Switch to Pro Account.”
4. Choose Account Type: Select either "Creator" or "Business."
5. Complete Setup: Follow the prompts to complete the setup.
Once your Pro account is set up, access the analytics by clicking on the three dots in the top right corner of your profile page, then selecting "Creator" or "Business" and finally "Analytics." You will find three main tabs: Overview, Content, and Followers.
Understanding Key Metrics

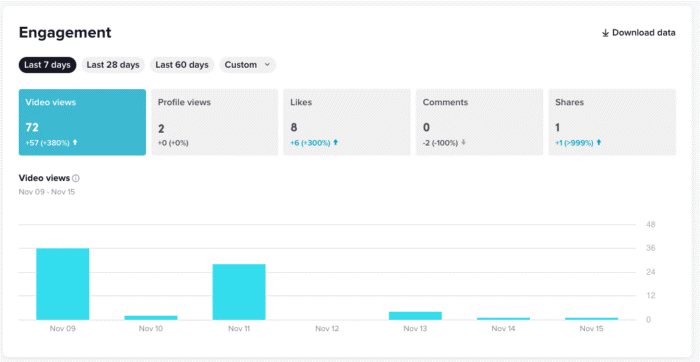
TikTok Analytics provides various metrics that help you gauge the performance of your content and understand your audience better. The primary metrics available include video views, profile views, and follower count.
Video Views
Video views represent the total number of times your videos have been watched. This metric is crucial for understanding the reach and popularity of your content. By analyzing the days with the highest views, you can determine the best times to post your videos.
Profile Views
Profile views indicate the number of times users have visited your profile. This metric helps you understand the overall interest in your content and profile. It can also be a valuable statistic when promoting your profile to brands and potential collaborators.
Followers
The follower count shows the total number of followers gained over a specific period. This metric is essential for tracking your growth trends and identifying which content attracts the most followers. Analyzing spikes in your follower count can help you understand what content drives growth and encourages users to follow you.
Leveraging Overview Data
Using the data from the Overview tab, you can identify patterns and trends in your content performance. For instance, if you notice that video views spike on weekends, you can plan to post your most important content during these times to maximize engagement.
Deep Dive into Content Analytics
Video Performance Metrics
The Content tab provides detailed insights into the performance of your individual videos. Key metrics include video views, trending videos, and hashtag performance.
Video Views
Video views show which videos are most popular and when they were viewed. By focusing on replicating successful content and posting at optimal times, you can enhance your overall content strategy.
Trending Videos
Trending videos indicate your top-performing videos and the impact of hashtags. This information is crucial for understanding how your videos are being discovered and which hashtags are driving the most traffic. By analyzing your top-performing hashtags, you can use them more frequently to increase visibility and engagement.
Optimizing Content Strategy
Based on the insights from the Content tab, you can refine your content strategy. For example, if certain hashtags or video formats perform well, incorporate them more frequently into your content. Additionally, consider the engagement metrics such as likes, comments, and shares to gauge the level of interaction your content receives. Higher engagement indicates more compelling content, which you can replicate to maintain audience interest.
Analyzing Follower Data
Demographic Insights
The Followers tab provides demographic insights that help you understand your audience better. Key demographic data includes gender breakdown, geographic data, and follower activity.
Gender Breakdown
Gender breakdown shows the distribution of your followers by gender. This information is useful for tailoring your content to appeal to the dominant gender group in your audience.
Geographic Data
Geographic data reveals where your followers are located. This metric is essential for scheduling your posts at times when your primary audience is most active, ensuring maximum engagement.
Follower Activity
Follower activity indicates when your followers are most active on TikTok. By posting during peak activity times, you can increase the likelihood of your content being seen and interacted with.
Creating Targeted Content
Using the demographic data, you can create content that resonates with your audience. For instance, if you have a large following of young adults, focus on trends and topics popular within that age group. Additionally, consider creating content that caters to the preferences of your most active demographic groups.
Advanced Analytics for Strategic Growth
Engagement and Conversion Metrics
Beyond the basic metrics, advanced analytics provide deeper insights into engagement and conversions.
Likes, Comments, and Shares
These metrics indicate the level of interaction your content receives. Higher engagement suggests more compelling content. Use this feedback to create similar content and foster a more interactive community.
Completion Rate
The completion rate shows how many viewers watched your video until the end. Higher completion rates indicate more engaging content. Aim to keep viewers watching by improving video quality and storytelling.
Click-Through Rate (CTR)
CTR represents the percentage of viewers who clicked on links in your bio or content. Optimize your call-to-actions (CTAs) to increase CTR and drive traffic to external sites.
Conversion Rate
The conversion rate shows the percentage of viewers who take a desired action, such as following your profile or visiting a website. Improve your content and CTAs to boost conversions and achieve your marketing goals.
Custom Analytics
For creators with specific goals, custom analytics can provide even deeper insights. Tools like Google Analytics and third-party TikTok analytics platforms offer advanced data tracking and reporting capabilities, allowing for more targeted and strategic decision-making.
Tips for Continuous Improvement
Stay Updated
TikTok frequently updates its algorithms and features. Stay informed about these changes to ensure your strategies remain effective.
Experiment and Adapt
Regularly test new content formats, hashtags, and posting times. Use your analytics to measure the success of these experiments and adapt accordingly.
Engage with Your Audience
Actively engage with your followers by responding to comments and messages. Building a community around your content can increase loyalty and engagement.
Leveraging Third-Party Tools for Enhanced Insights
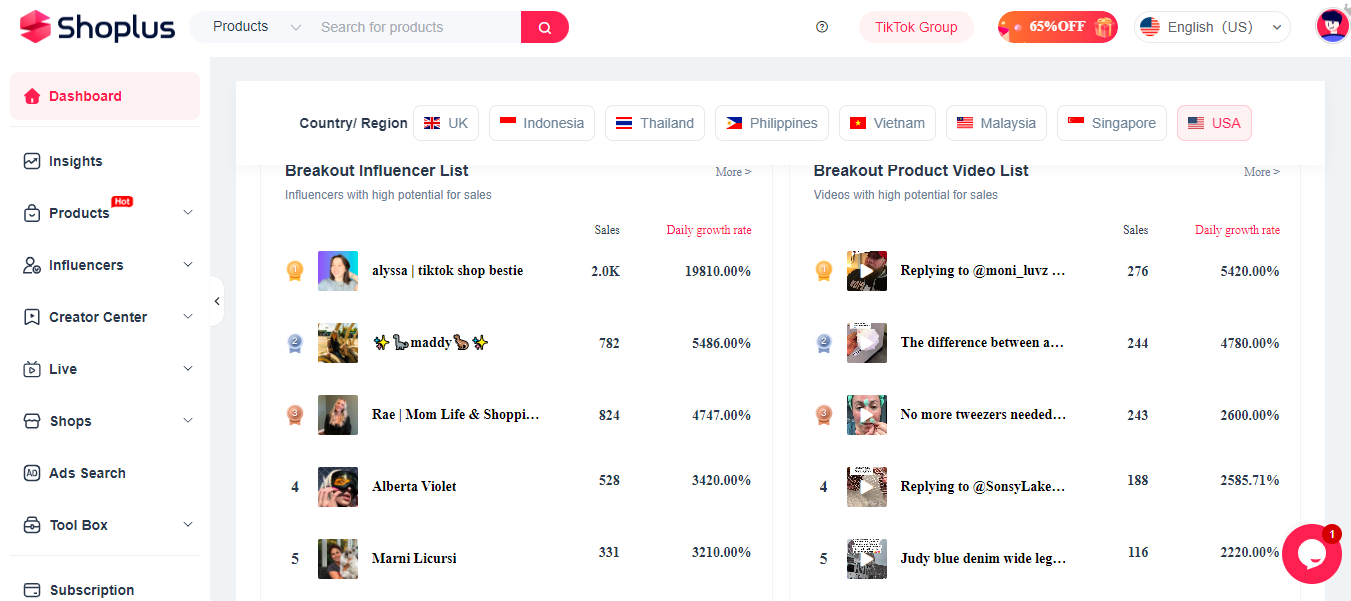
To gain more comprehensive insights into your TikTok performance, consider using third-party TikTok analytics tools like Shoplus. These tools offer precise real-time data on metrics such as views, likes, comments, shares, and sales, enabling you to understand user behavior and preferences more effectively. With Shoplus, you can draw inspiration for new videos, identify top-performing TikTok creators, and analyze your competitors. This data-driven approach allows you to make informed decisions, optimizing both your promotional strategies and content creation. By integrating tools like Shoplus into your workflow, you can elevate your TikTok presence through strategic, data-backed improvements.

Conclusion
TikTok Analytics is a powerful tool for content creators aiming to grow their presence on the platform. By understanding and leveraging these metrics, you can create more effective content, engage your audience better, and achieve significant growth. Remember, success on TikTok is not just about creating viral content but about consistently analyzing your performance and adapting your strategies to meet your audience's needs.
By following the comprehensive guide outlined above, you can master the art of using TikTok Analytics to enhance your content strategy and achieve sustained growth on the platform. Happy creating!