
As of today, it has been a month since the US passed the "TikTok Ban." However, the TikTok US e-commerce business seems to be moving forward without pause.
On one hand, TikTok has formally filed a lawsuit against the US government, fiercely fighting back.
On the other hand, in terms of e-commerce policies in the US, TikTok has relaxed the threshold for influencer accounts. Previously requiring 5,000 followers, it has now been lowered to 1,000 followers to enable influencer marketing. Simultaneously, the threshold for cross-border stores has also been adjusted.
Various signs indicate that the underlying market in the US is still robust, with dividends yet to be fully exploited. Data observed by Shoplus shows that the GMV (Gross Merchandise Volume) scale in the US increased by 25.2% month-on-month in May, further confirming this viewpoint.
Let's delve into the specific performance of the US market this month in this comprehensive TikTok data report.
1. US Market Overview
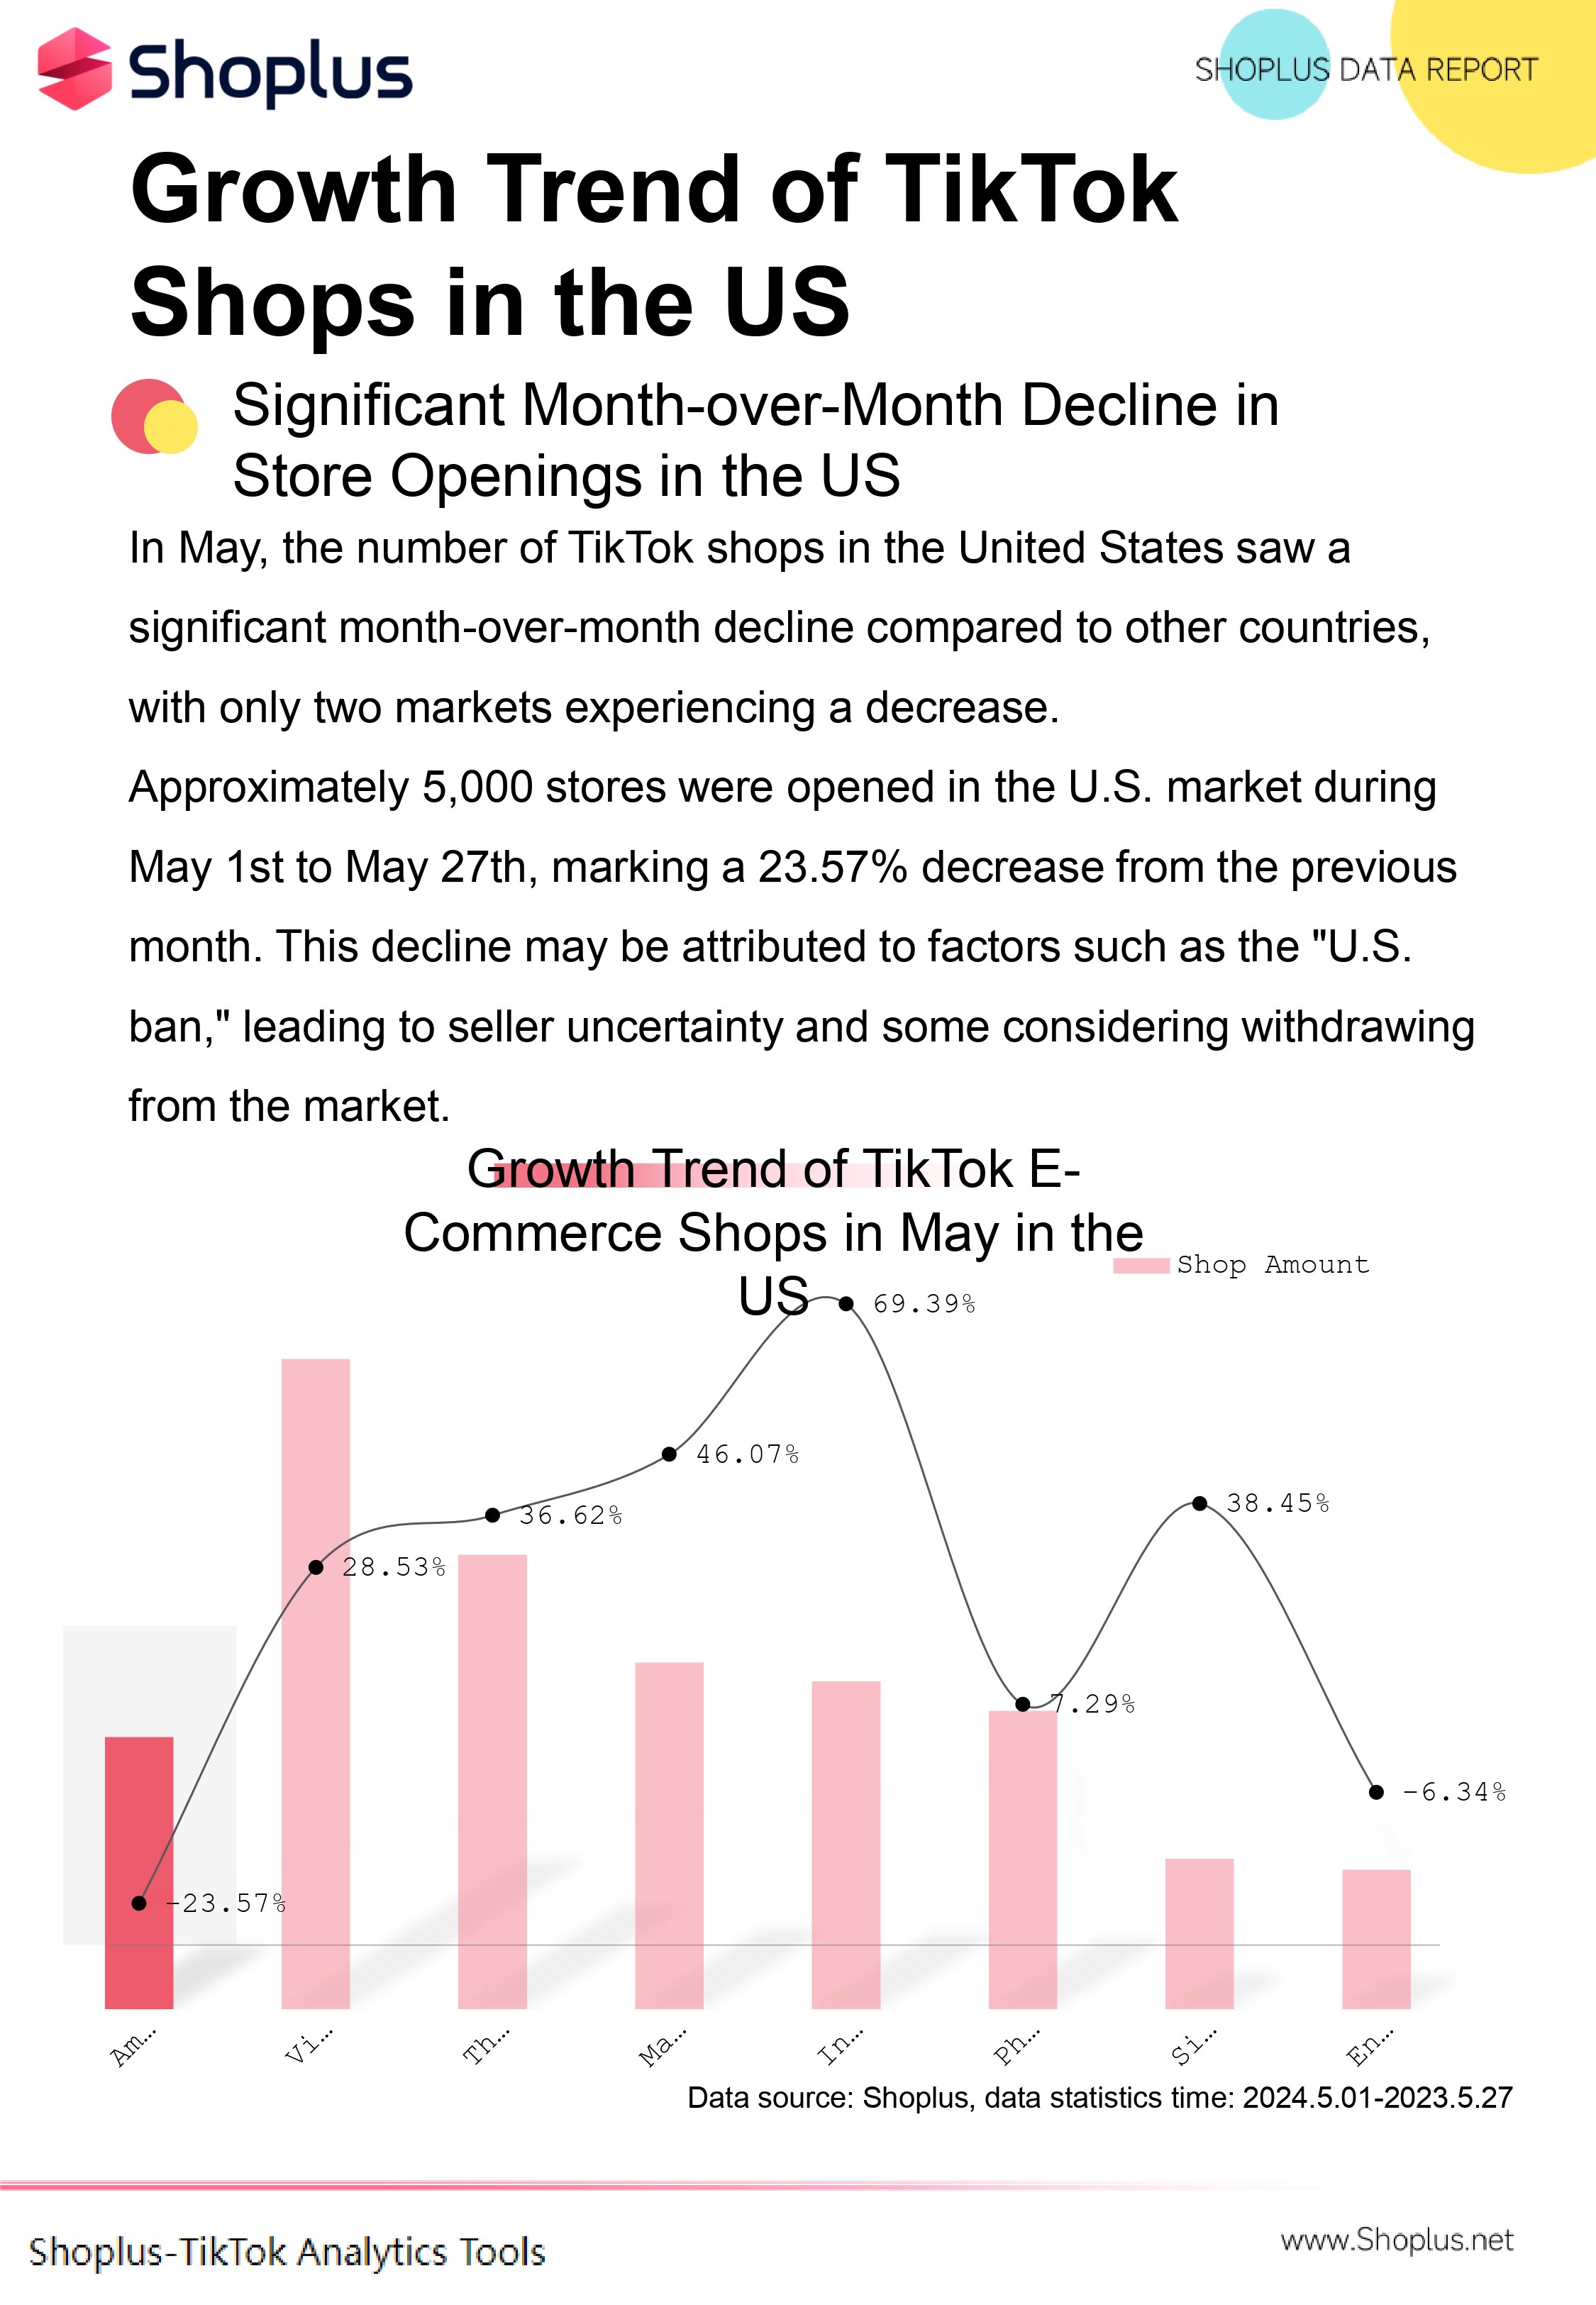
According to Shoplus statistics, compared to several other countries, the number of TikTok stores in the US decreased month-on-month, making it one of the only two declining markets.
In May (1st to 27th), the number of store openings in the US market decreased by 23.57% compared to the previous month. This decline may partly be due to the impact of the "TikTok Ban," causing some sellers to lack confidence in market expectations.
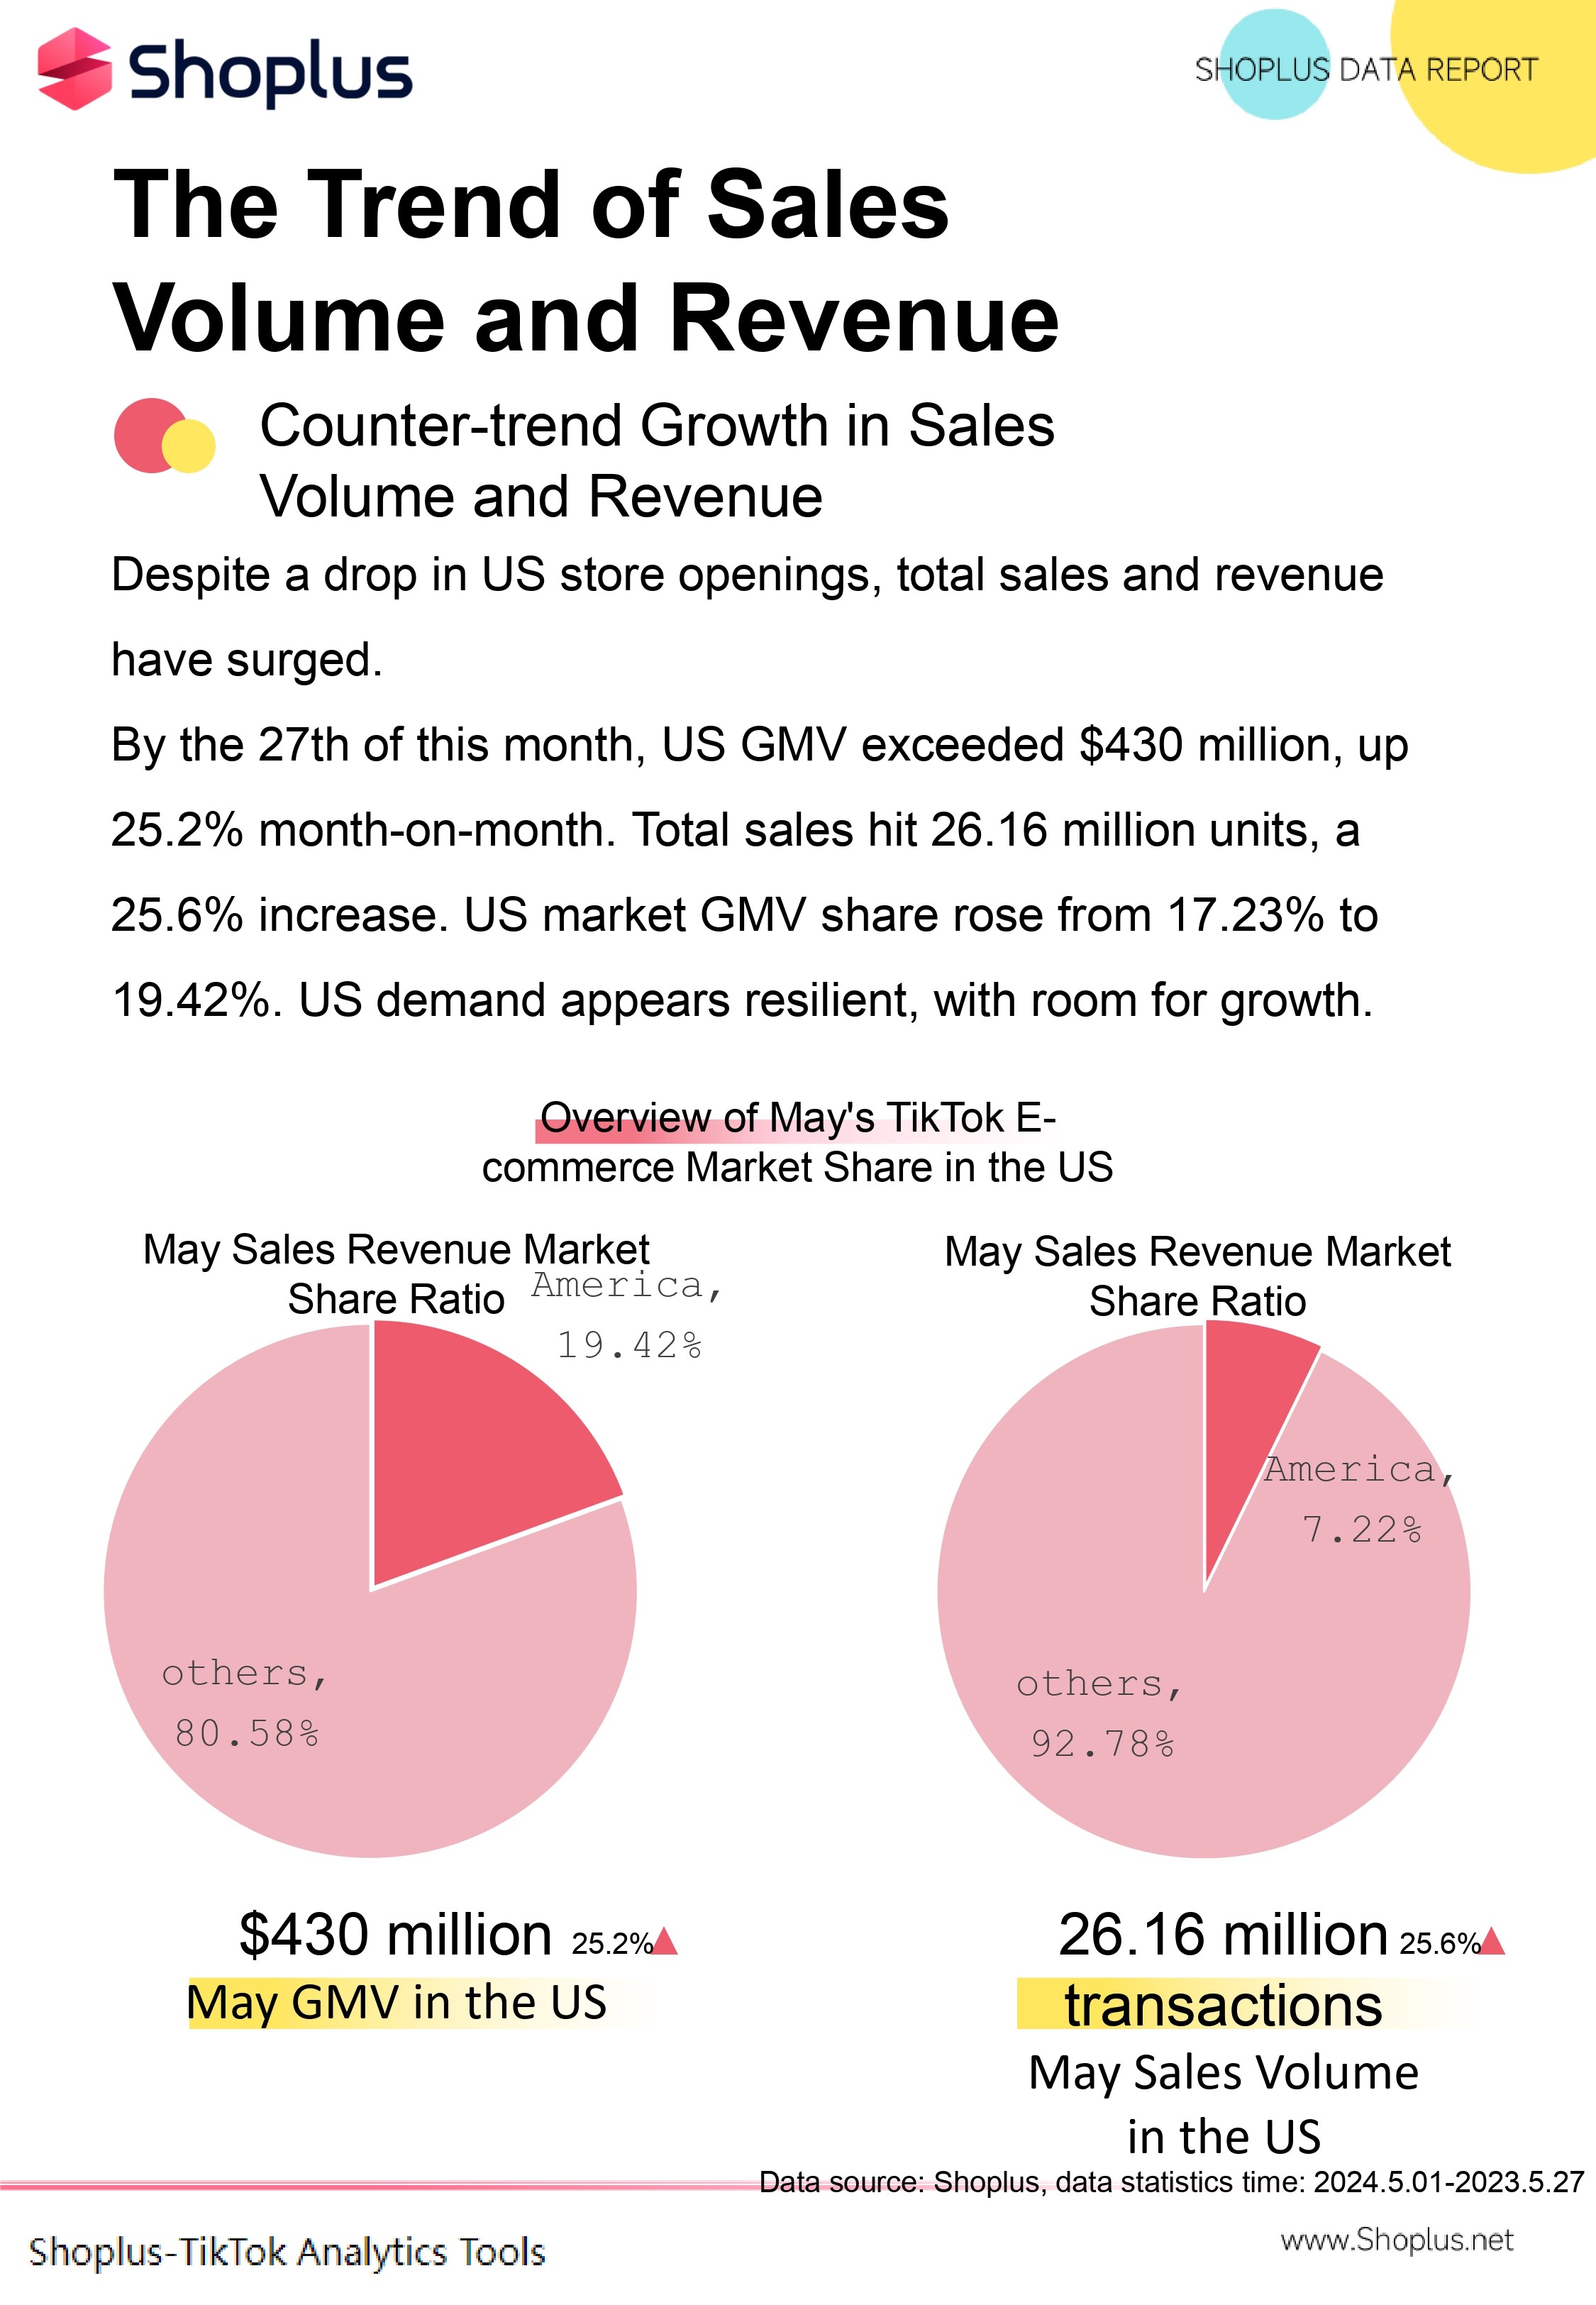
Despite the decrease in the number of store openings in the US, total sales and revenue in the US have surged.
As of the 27th of this month, the cumulative GMV scale in the US this month has exceeded $430 million, a 25.2% increase compared to the previous month. Similarly, total sales reached 26.16 million orders, a 25.6% increase month-on-month.
Compared to several other TikTok markets, the US, due to its higher average order value (AOV), although accounting for less than 10% of the total sales volume, has seen its GMV share rise from 17.23% last month to 19.42% this month.
Currently, it appears that the demand in the US market has not been affected by external factors, and the upward momentum remains strong.
Specifically, looking at each category:
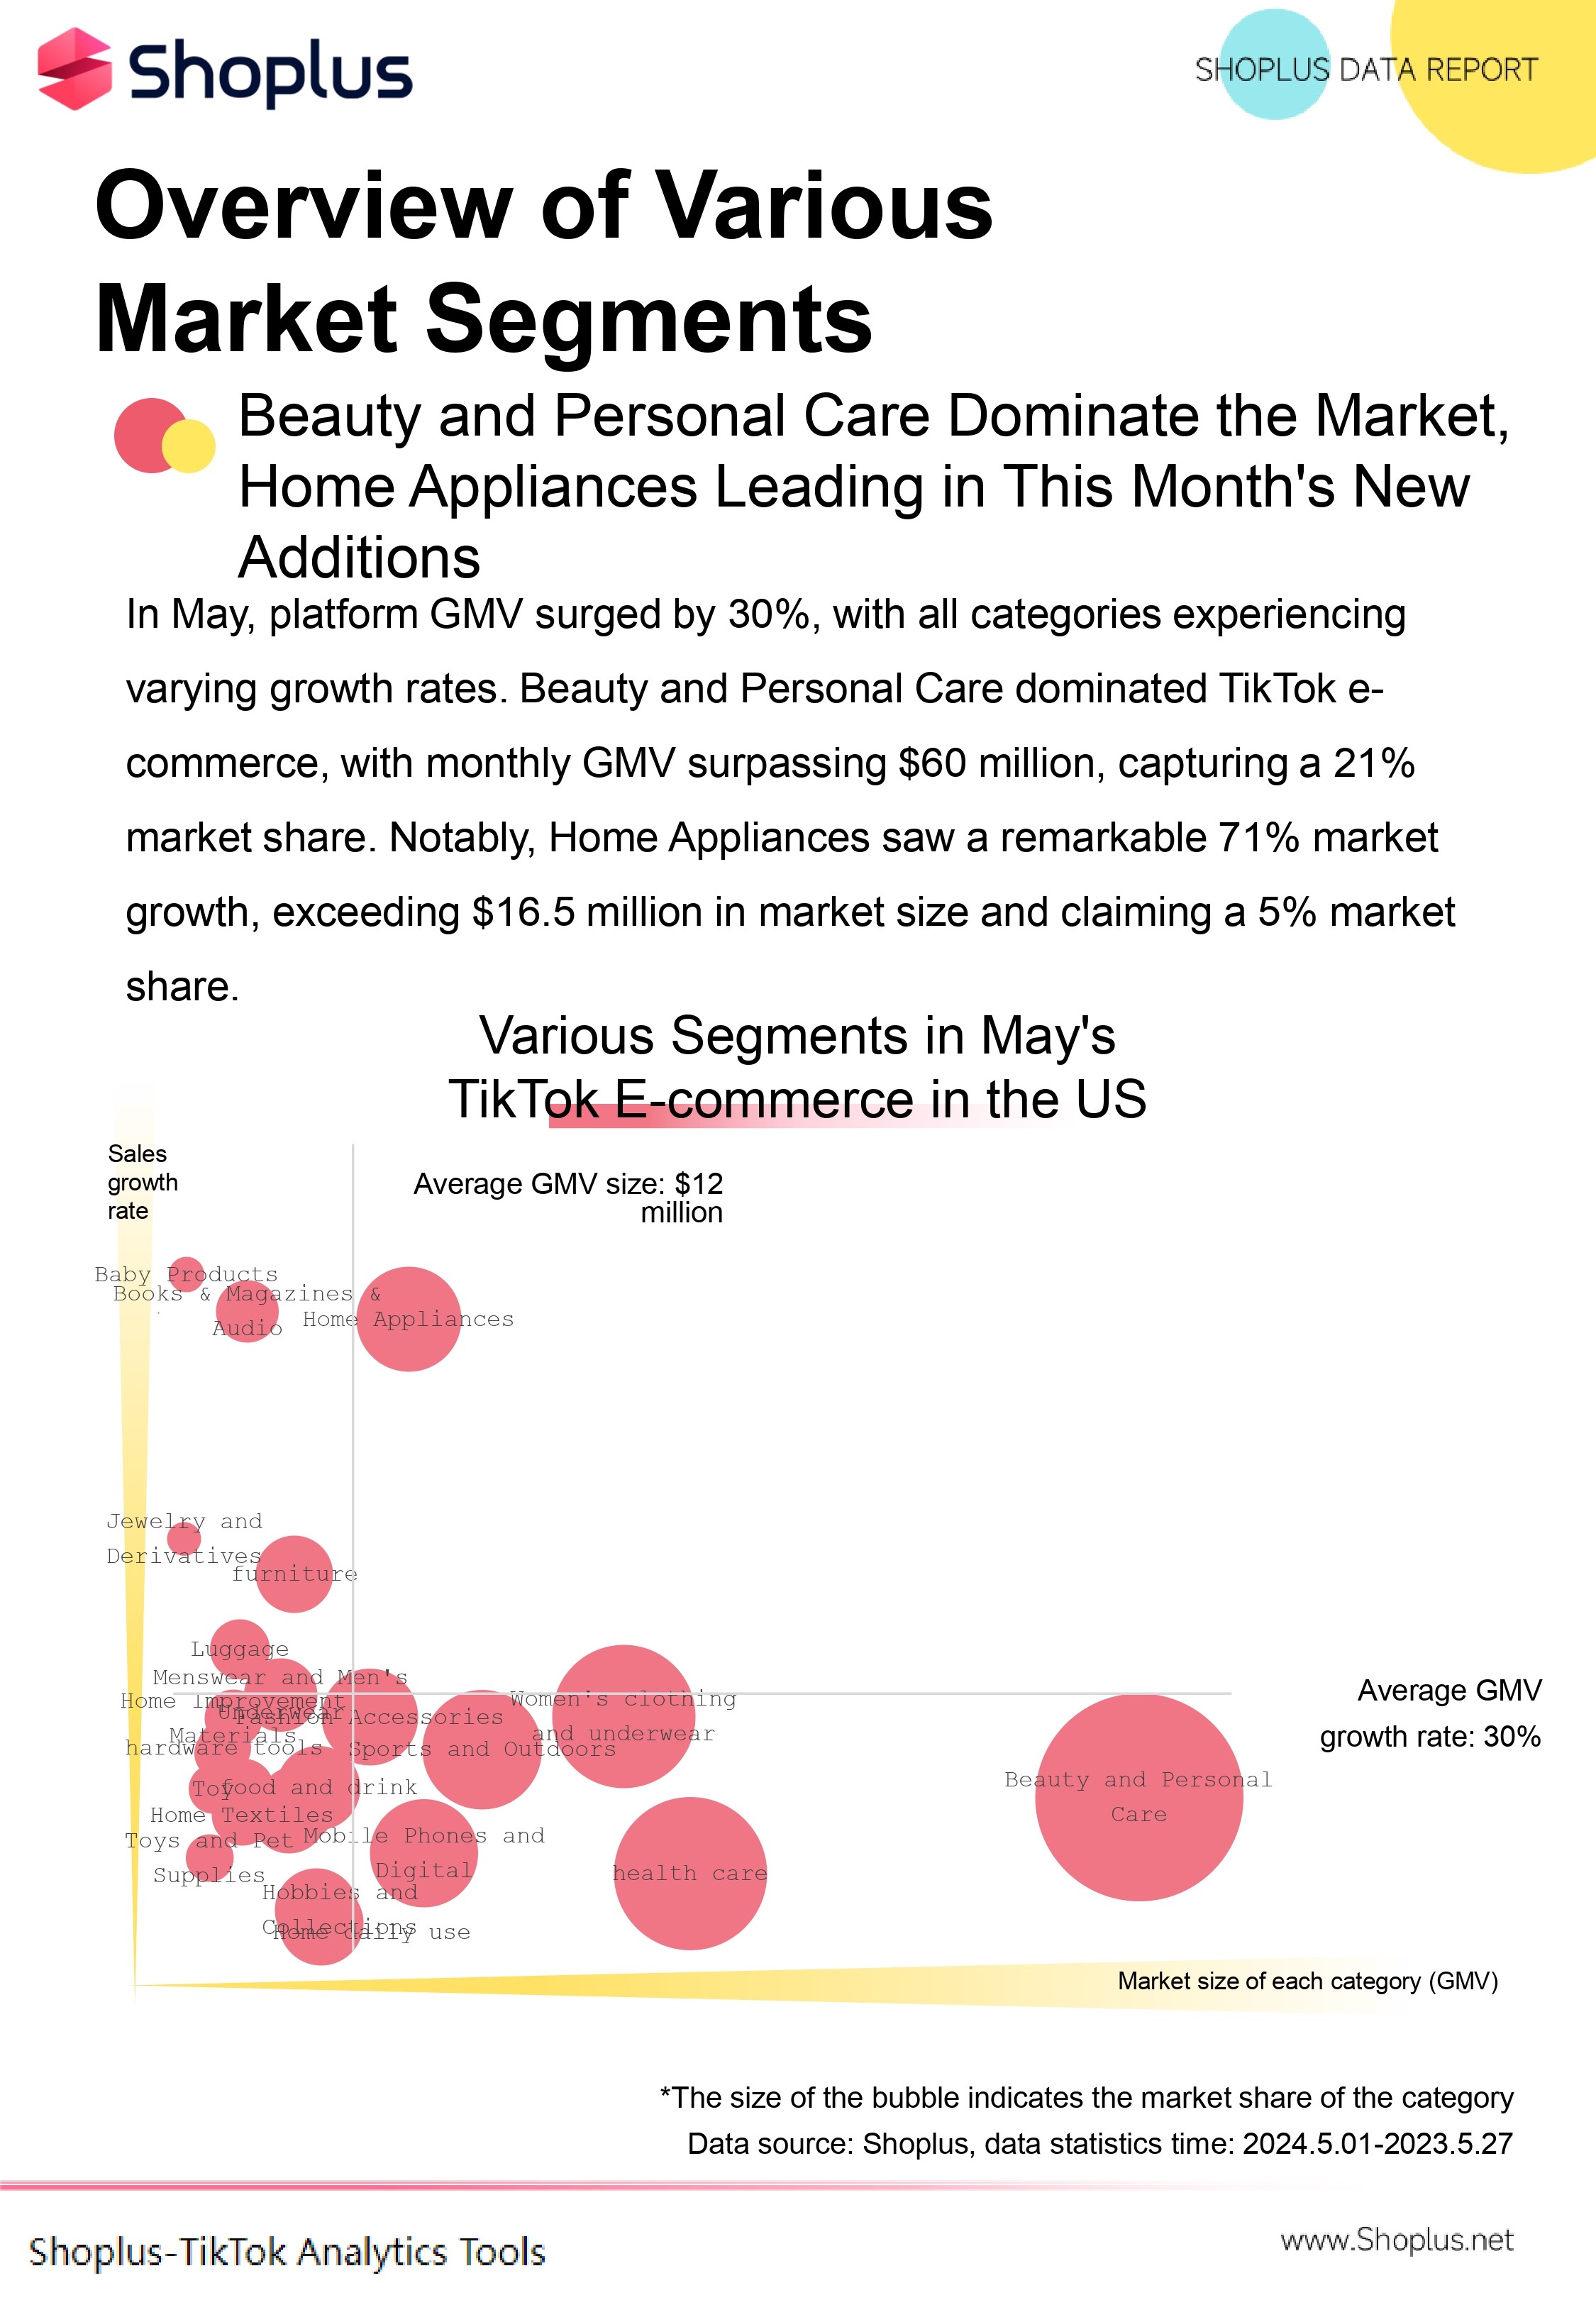
The average GMV growth rate of categories in the US in May was 30%, with each category experiencing varying degrees of growth.
Beauty and personal care products are the largest category in TikTok e-commerce, with a monthly GMV scale exceeding $60 million, accounting for 21% of the market share. Next is the health care category.
In terms of growth rate, some smaller categories such as maternal and child products, household appliances, and books have shown remarkably high growth rates, which should not be underestimated. Among them, the market growth rate of household appliances is also very significant, soaring by 71%, with a market size exceeding $16 million this month.
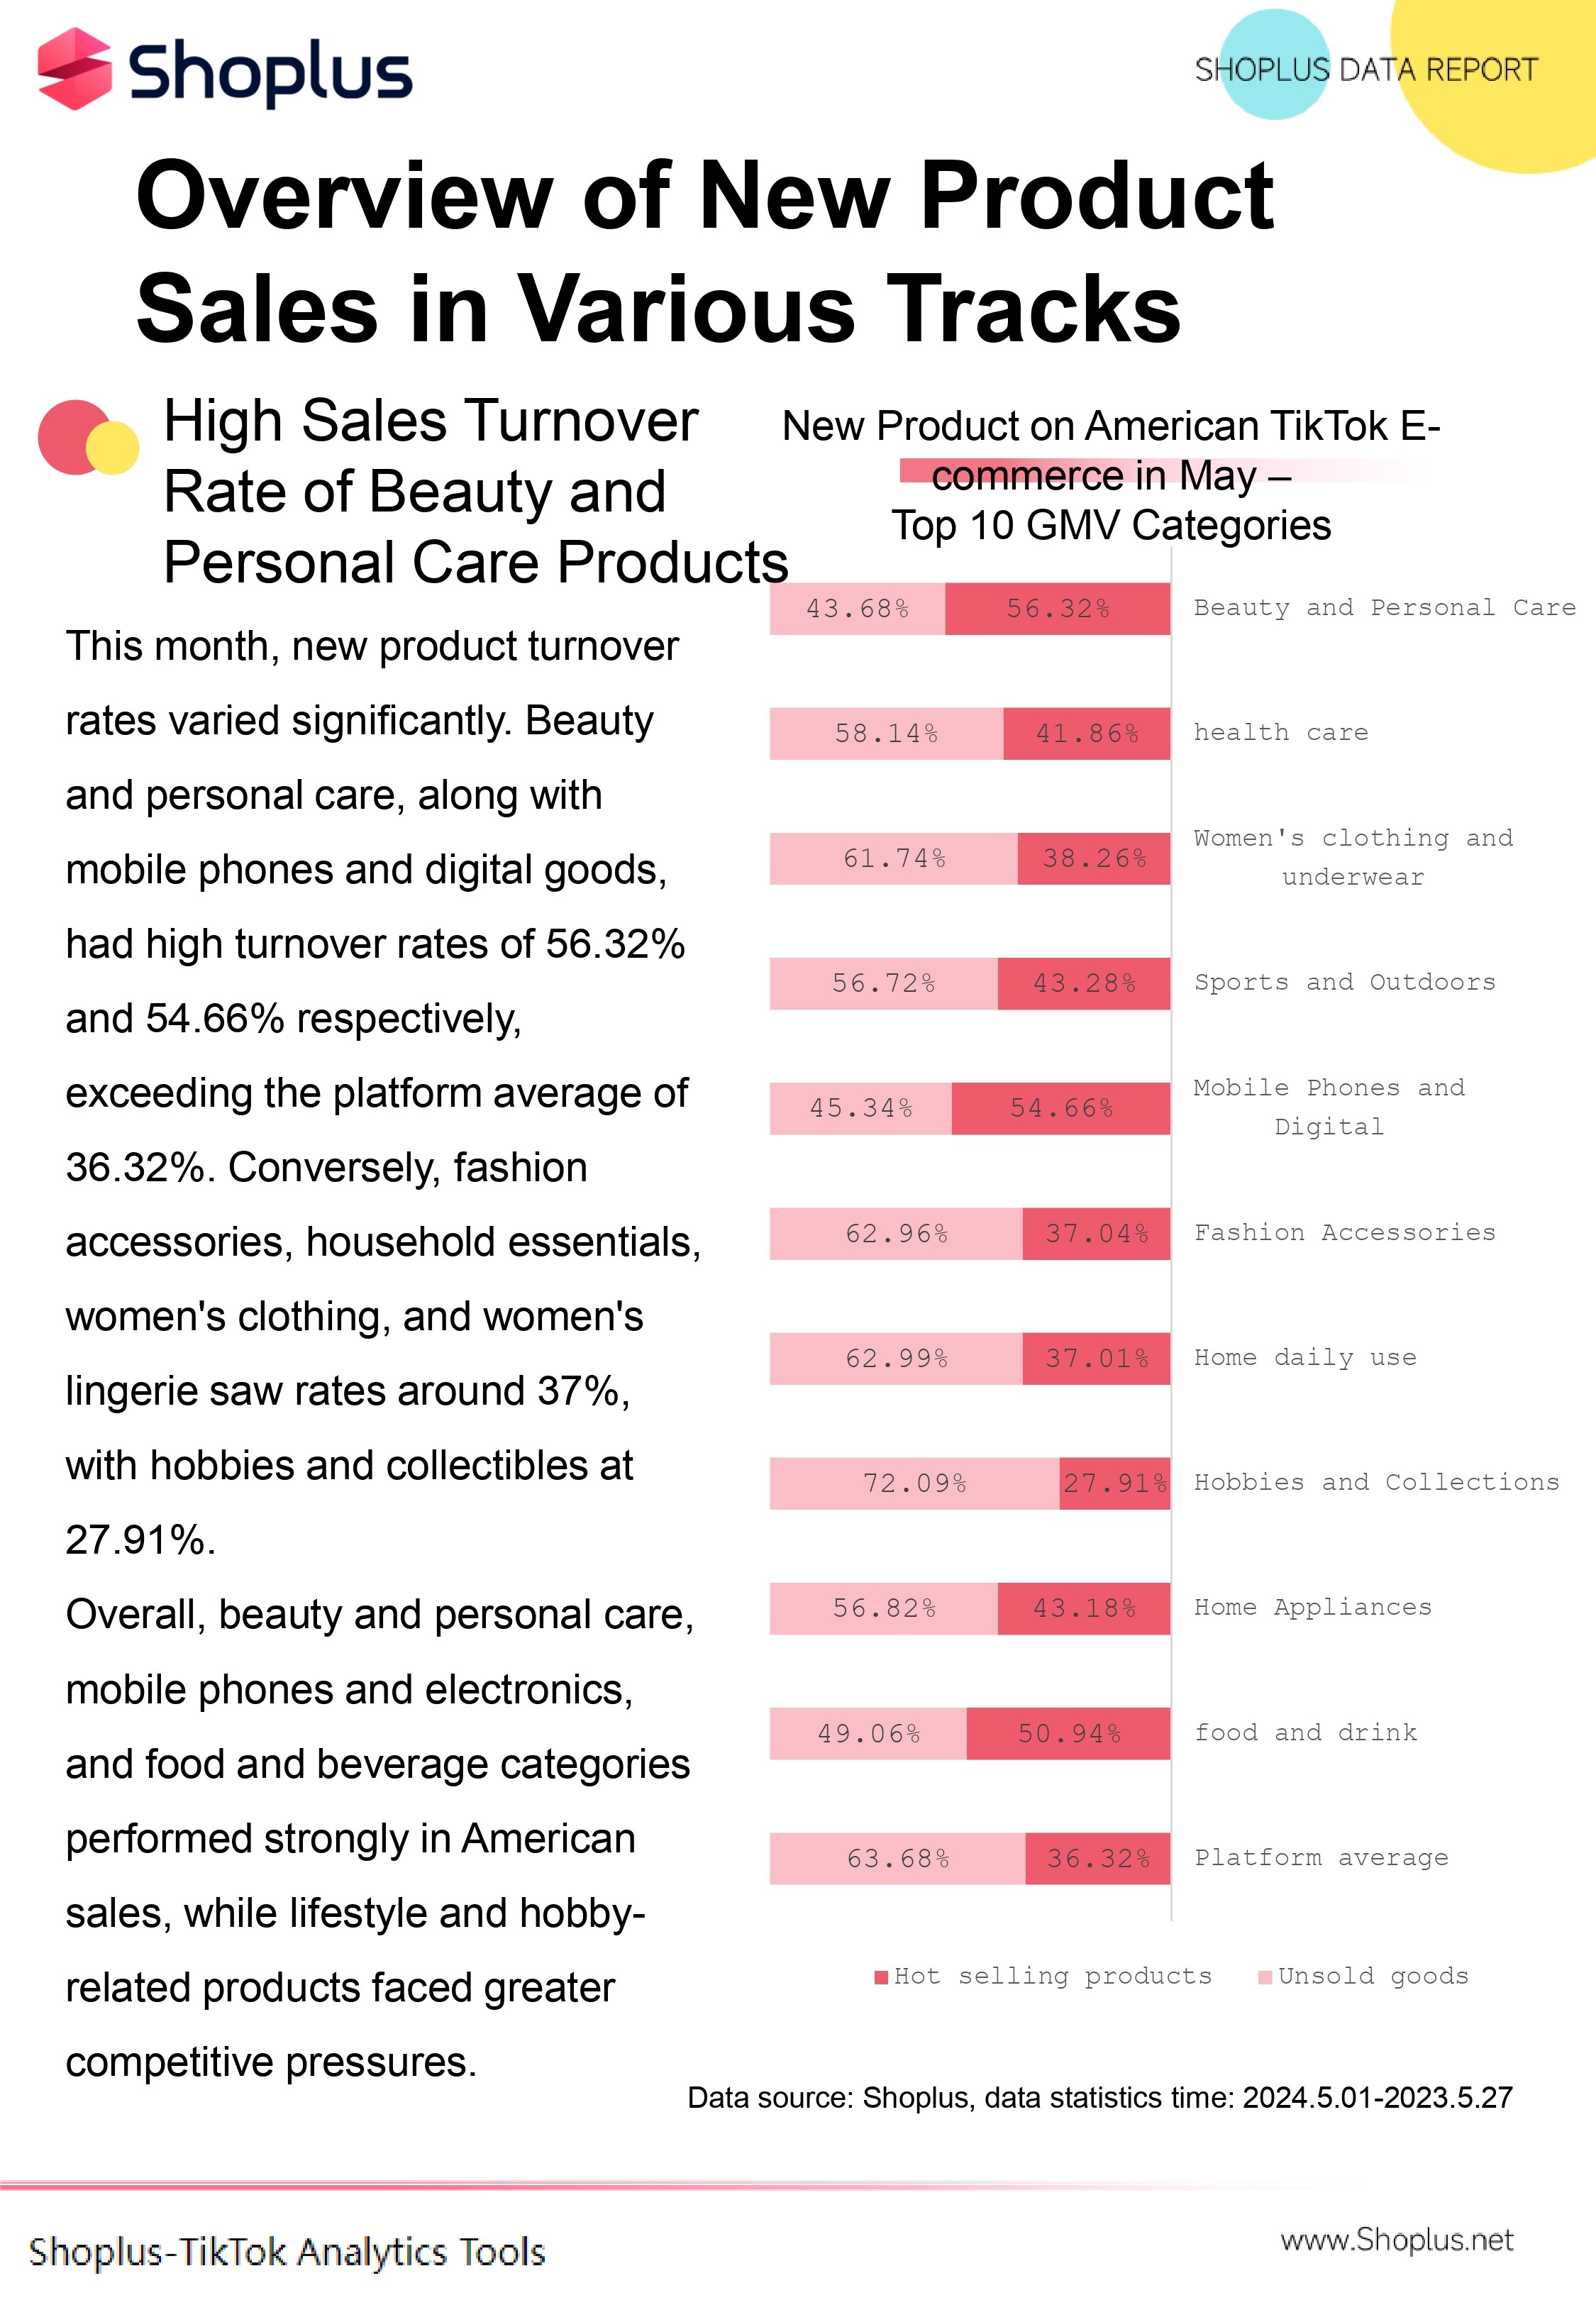
In terms of the rate of new product turnover this month, the differences between different categories are evident.
The turnover rates of beauty and personal care products and mobile phones and digital products are 56.32% and 54.66%, respectively, significantly higher than the platform's average of 36.32%. In other words, these categories are more likely to generate orders on the platform.
On the other hand, the turnover rates of fashion accessories, household daily necessities, and women's clothing and underwear are 37.04%, 37.01%, and 38.26%, respectively, while hobbies and collectibles are as low as 27.91%.
Overall, beauty and personal care products, mobile phones and digital products, and food and beverage categories have performed strongly in sales in the US, while some lifestyle and hobby products face greater sales and competition pressure.
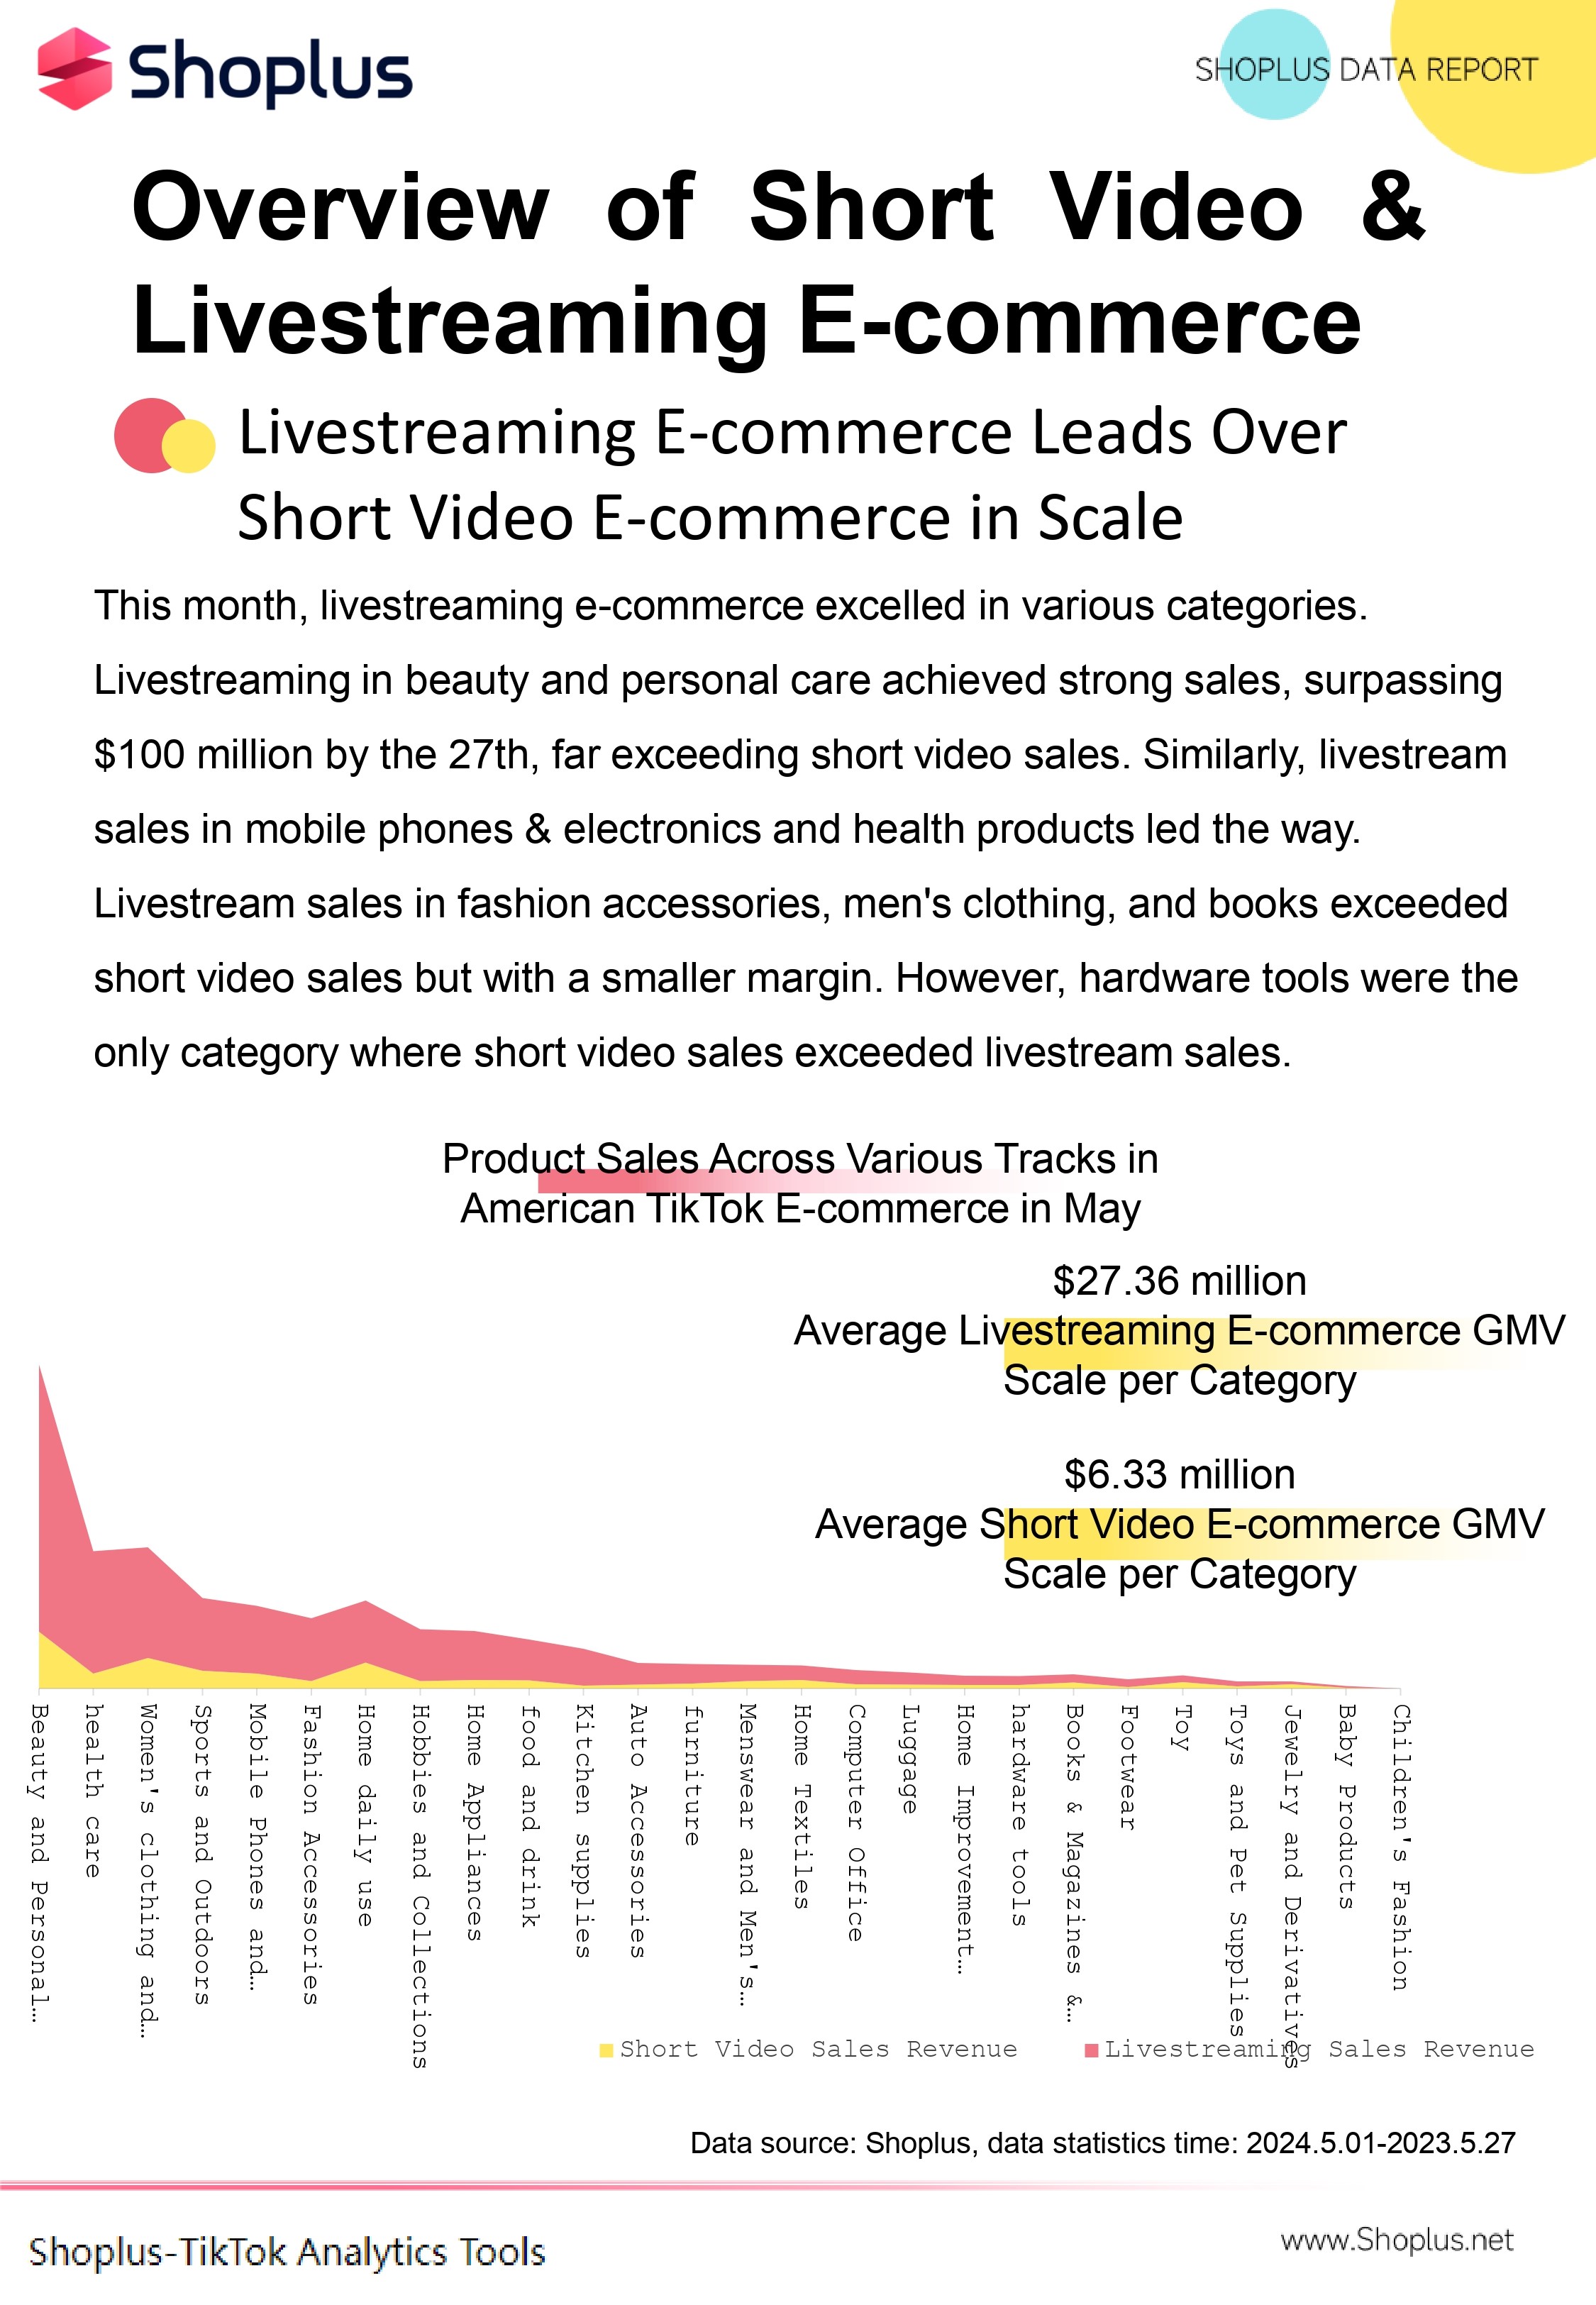
This month, live streaming sales have performed outstandingly in multiple categories.
The live streaming sales force of beauty and personal care products is strong, with sales exceeding $100 million as of the 27th, far exceeding short video sales. In addition, the live streaming sales of mobile phones and digital products and health care products also lead.
The live streaming sales of fashion accessories, men's clothing, and books, while higher than short video sales, have a smaller gap. Hardware tools are the only category where live streaming sales exceed short video sales.
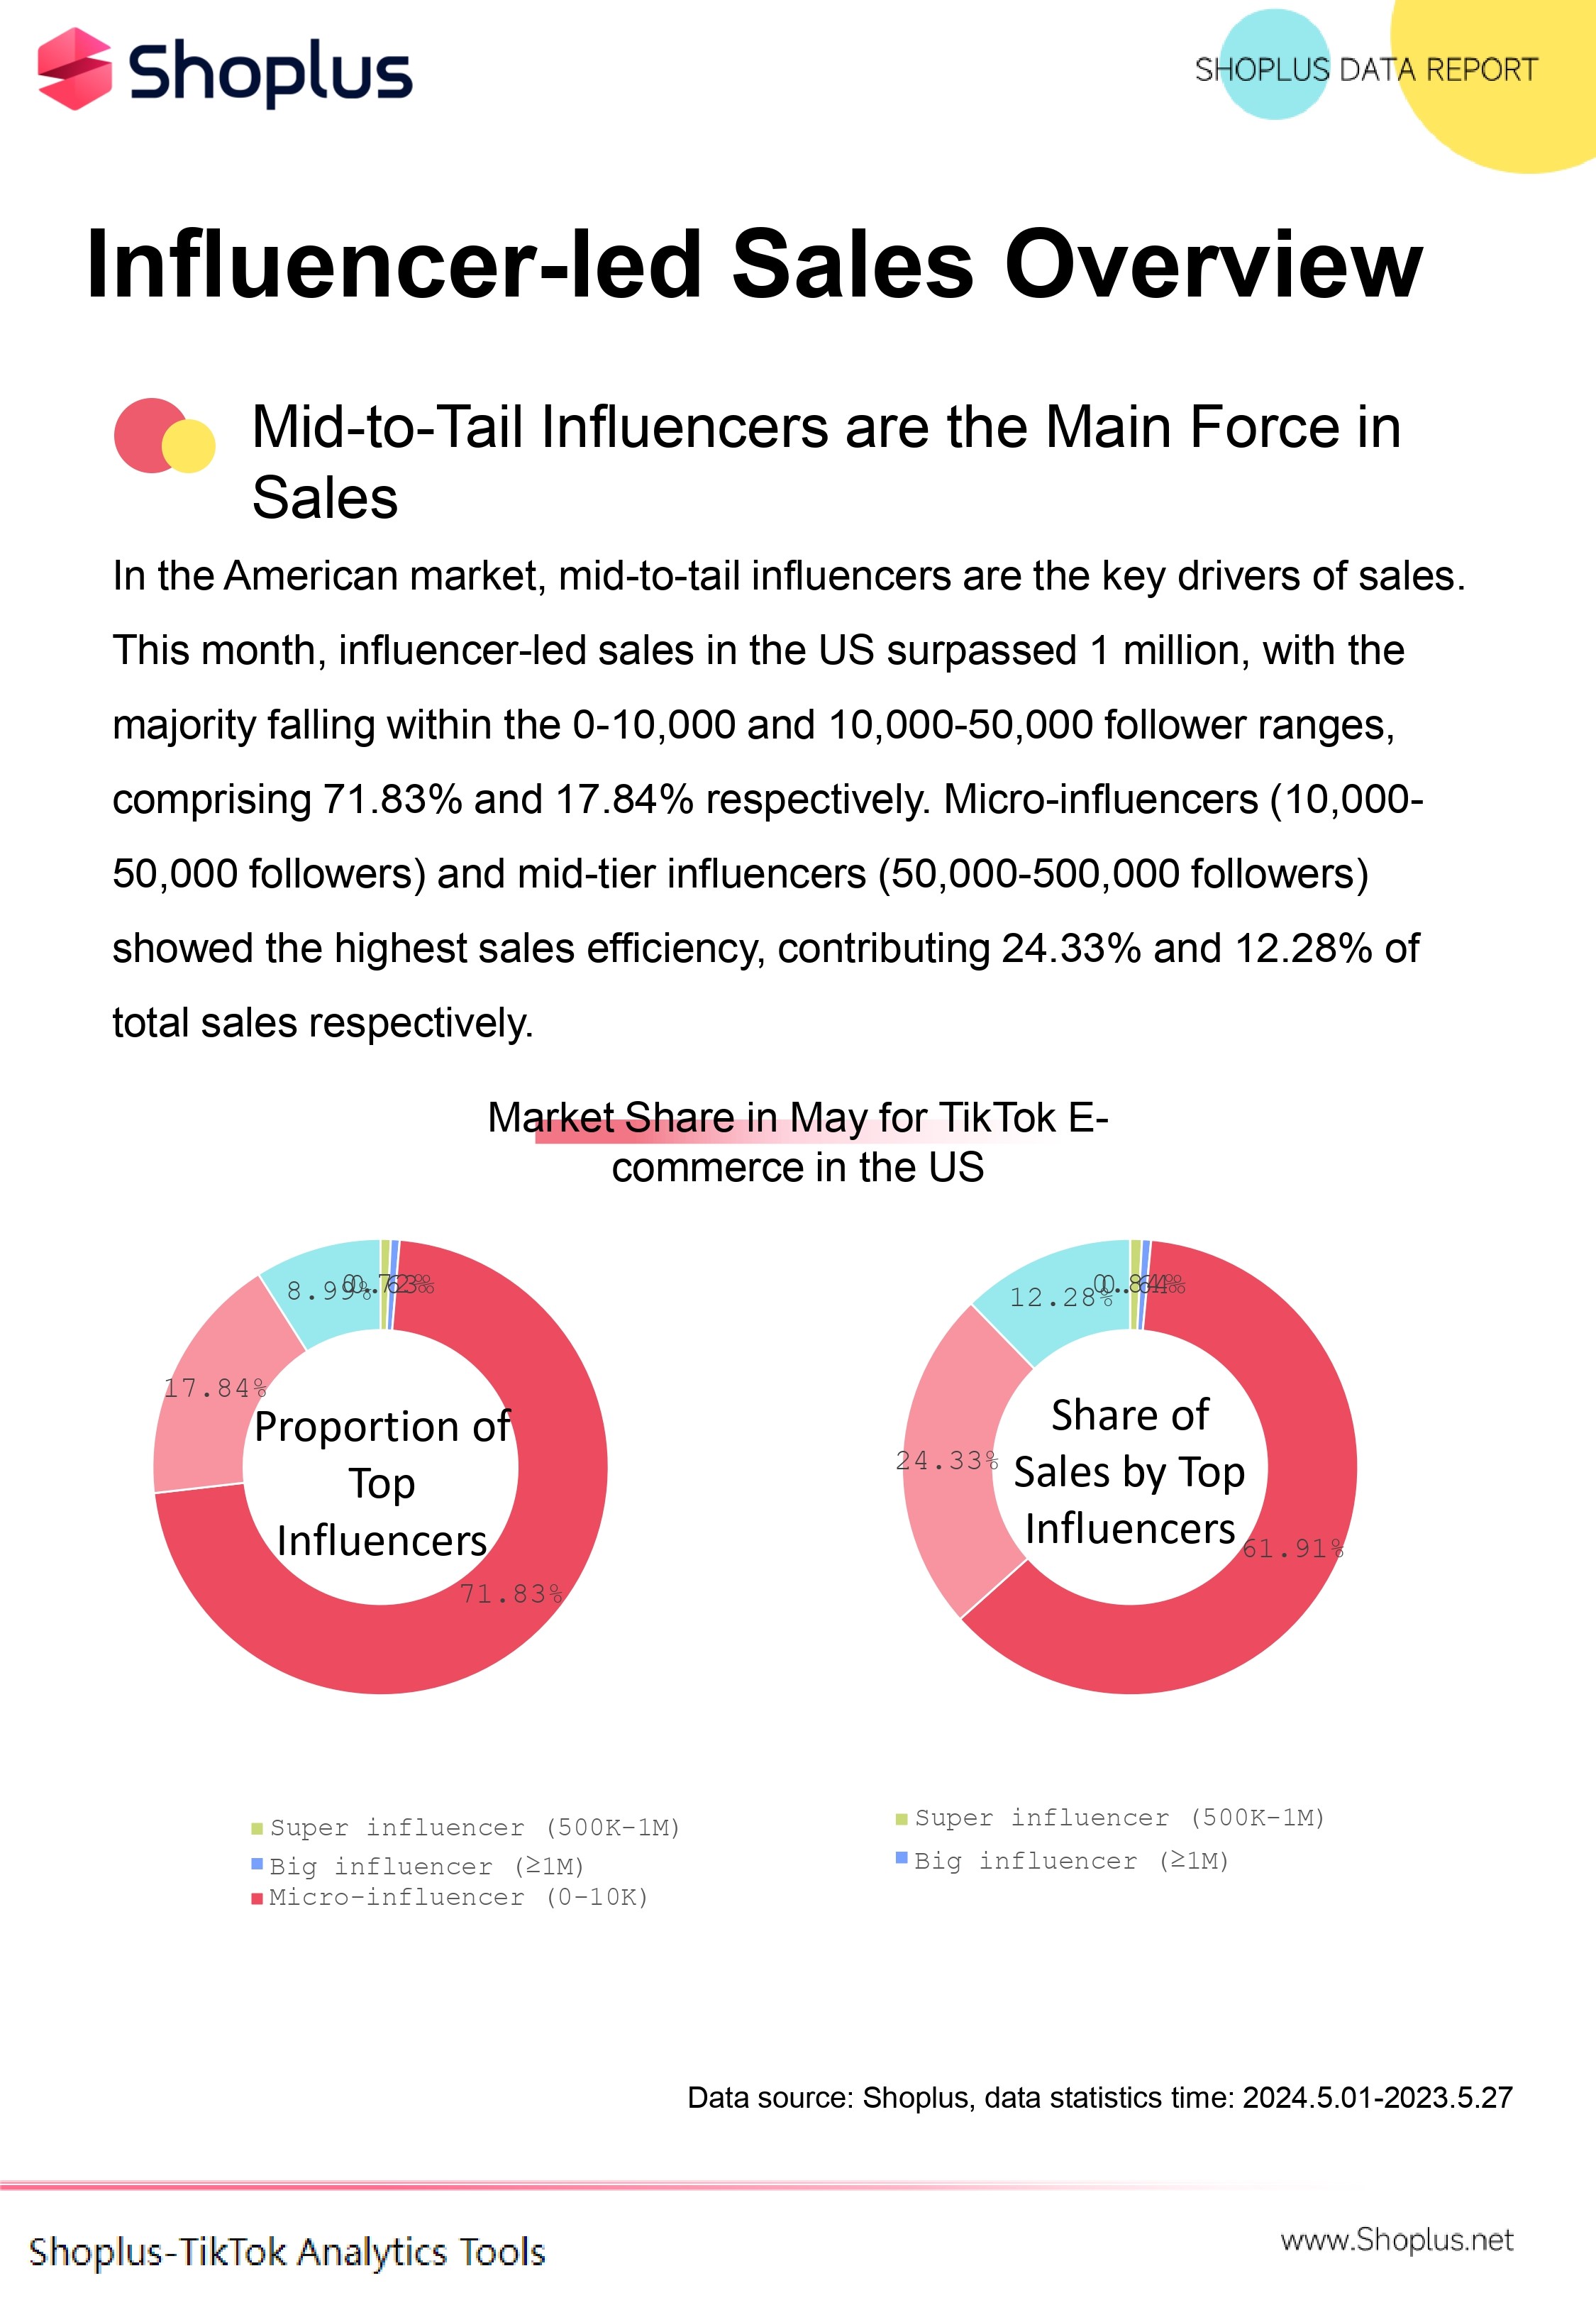
On the influencer side in the US, mid-tail influencers have the highest number of sales and are also the absolute main force contributing to sales.
The number of influencer sellers in the US this month has exceeded 1 million, with the highest proportion of influencers with 0-10,000 and 10,000-50,000 followers, accounting for 71.83% and 17.84%, respectively.
In terms of sales volume, micro influencers (10,000-50,000 followers) and mid-tier influencers (50,000-500,000 followers) have the highest output-to-benefit ratio, accounting for 24.33% and 12.28% of sales, respectively.
Overall, the e-commerce ecosystem in the US is developing towards better quality and scale, and the overall market is bound to continue to grow larger in the future.
2. US Ranking Details
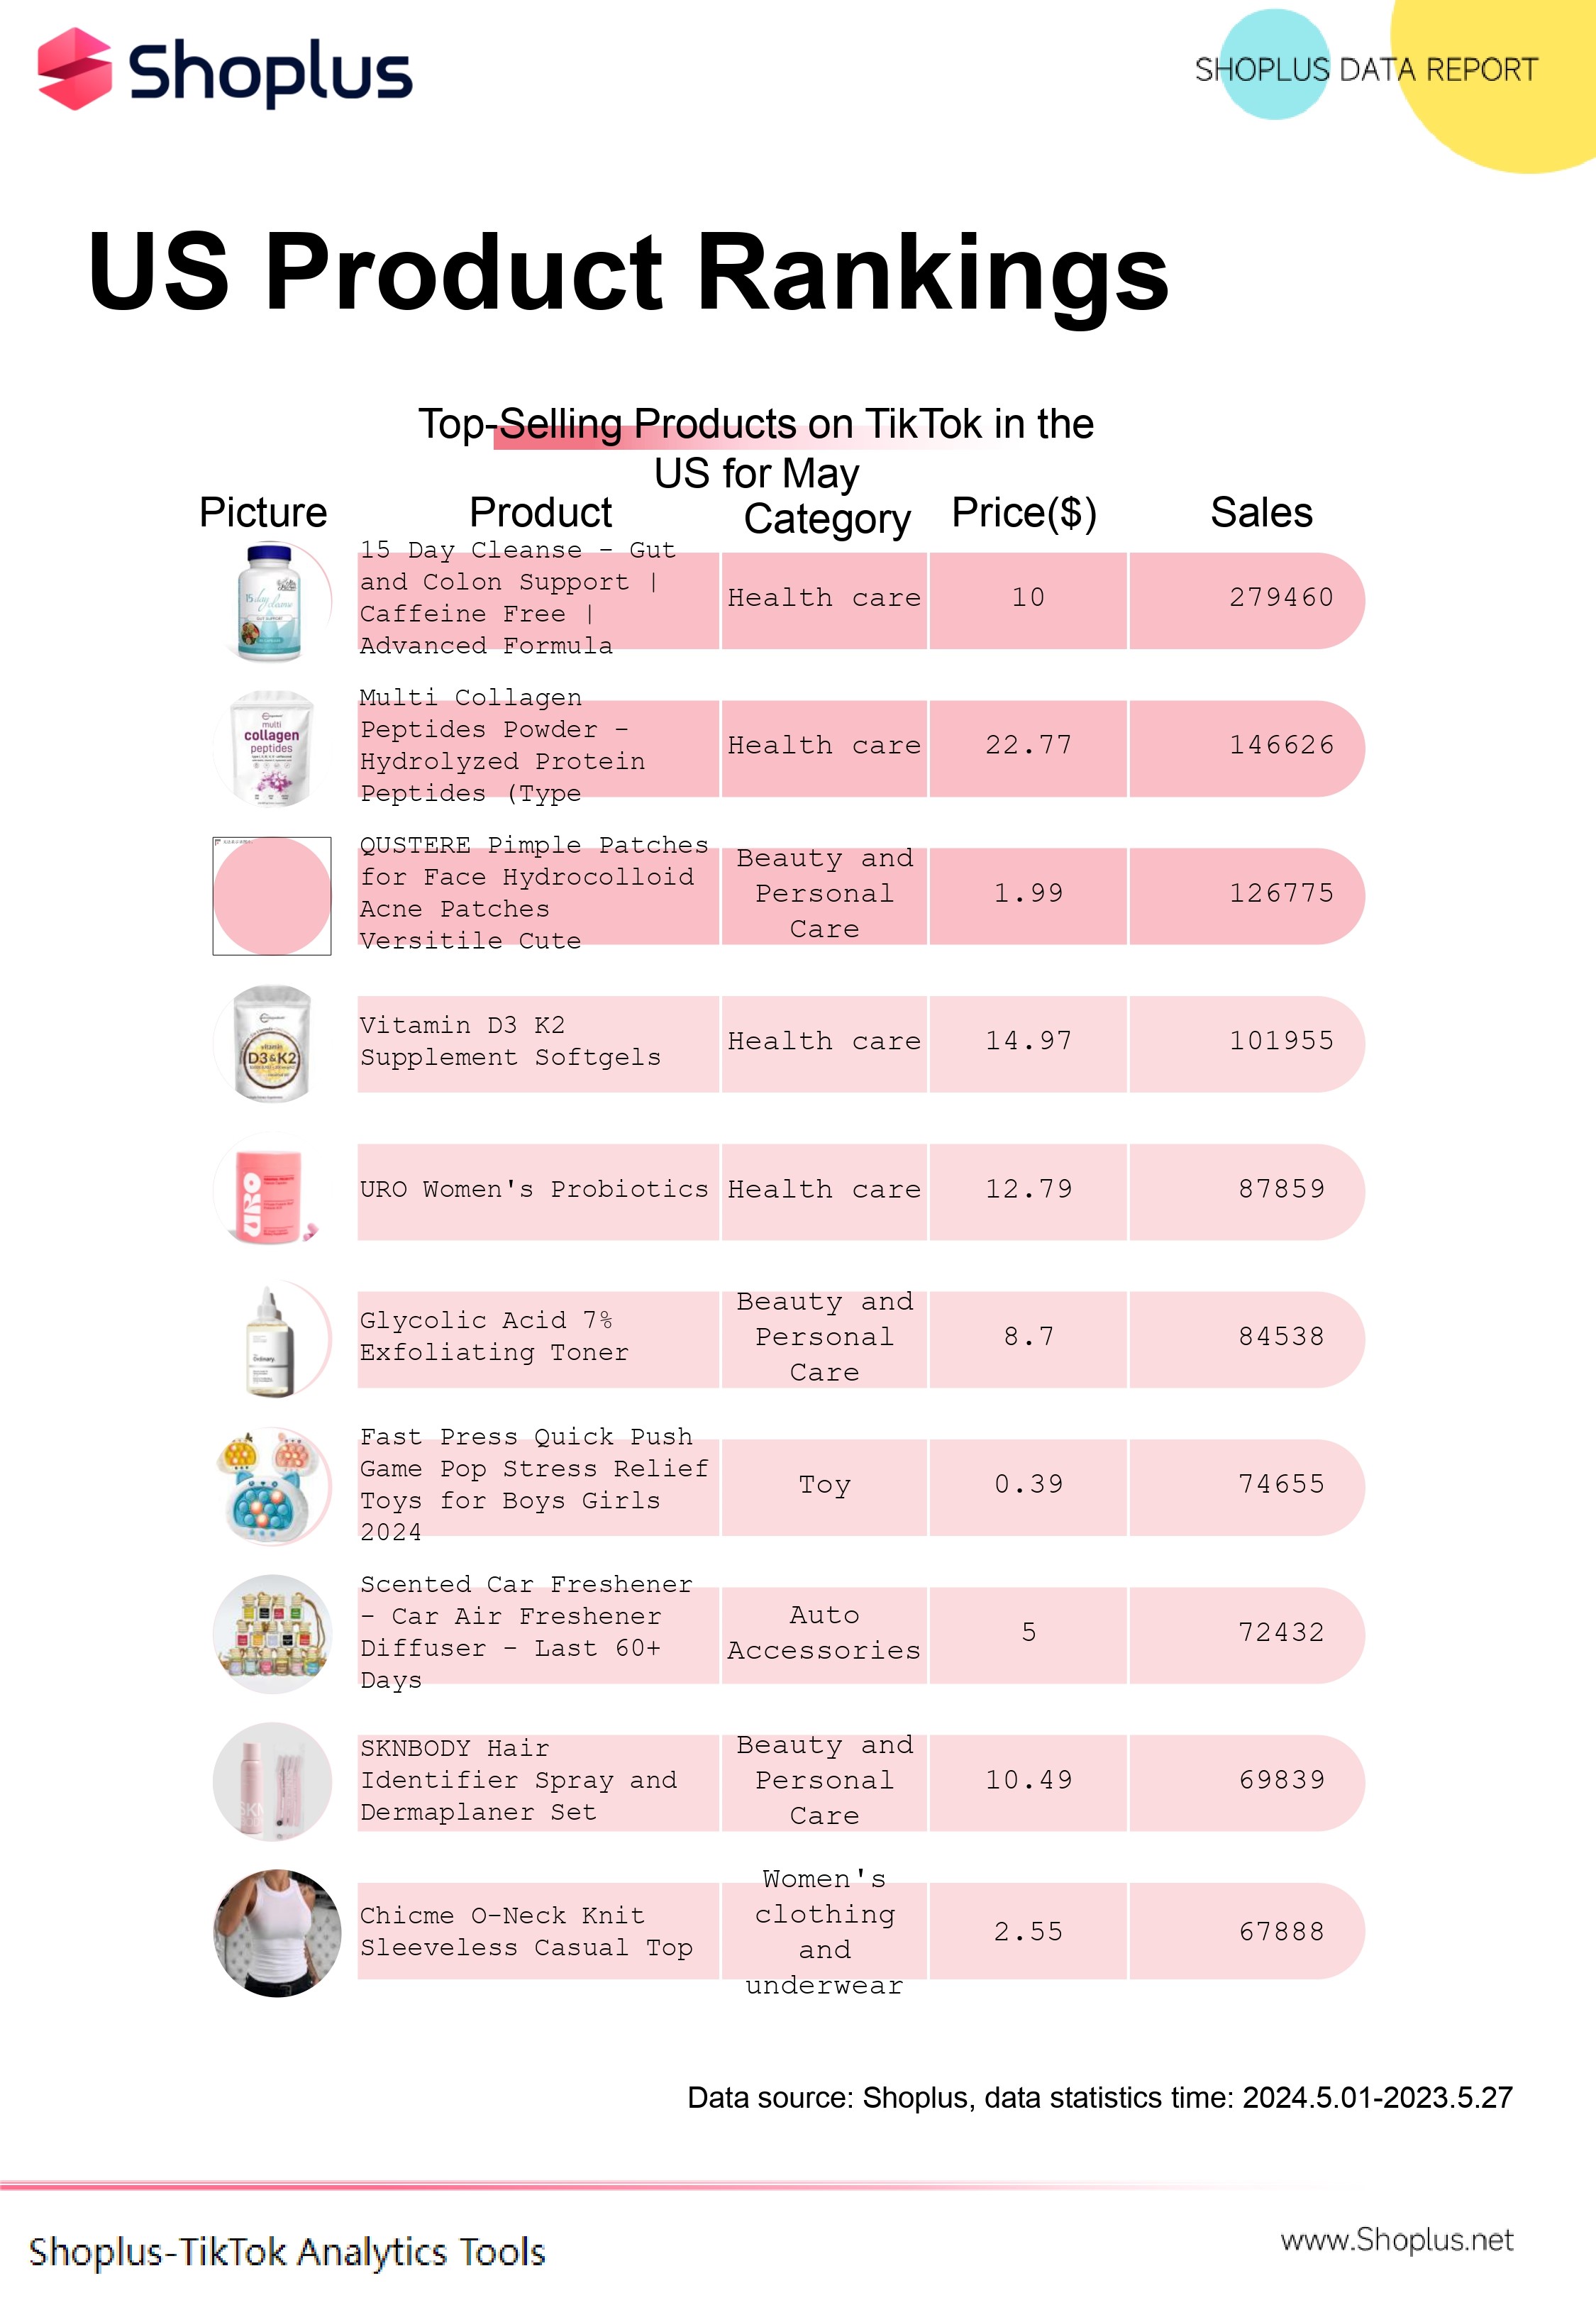
In this month's product rankings, health care products and beauty and personal care products are the most popular categories.
Among them, the top 1 and top 2 health products have sales of 270,000 and 140,000, respectively. According to Shoplus observations, both of these products have been on the shelves for over six months and still have strong sales.
The highest-selling beauty and personal care product is the "pimple patch" analyzed in the previous period, with cumulative sales exceeding 120,000.
Other products, such as the decompression toy at Top 7, the car aromatherapy at Top 8, and the women's sleeveless T-shirt at Top 10, all have good sales performance.
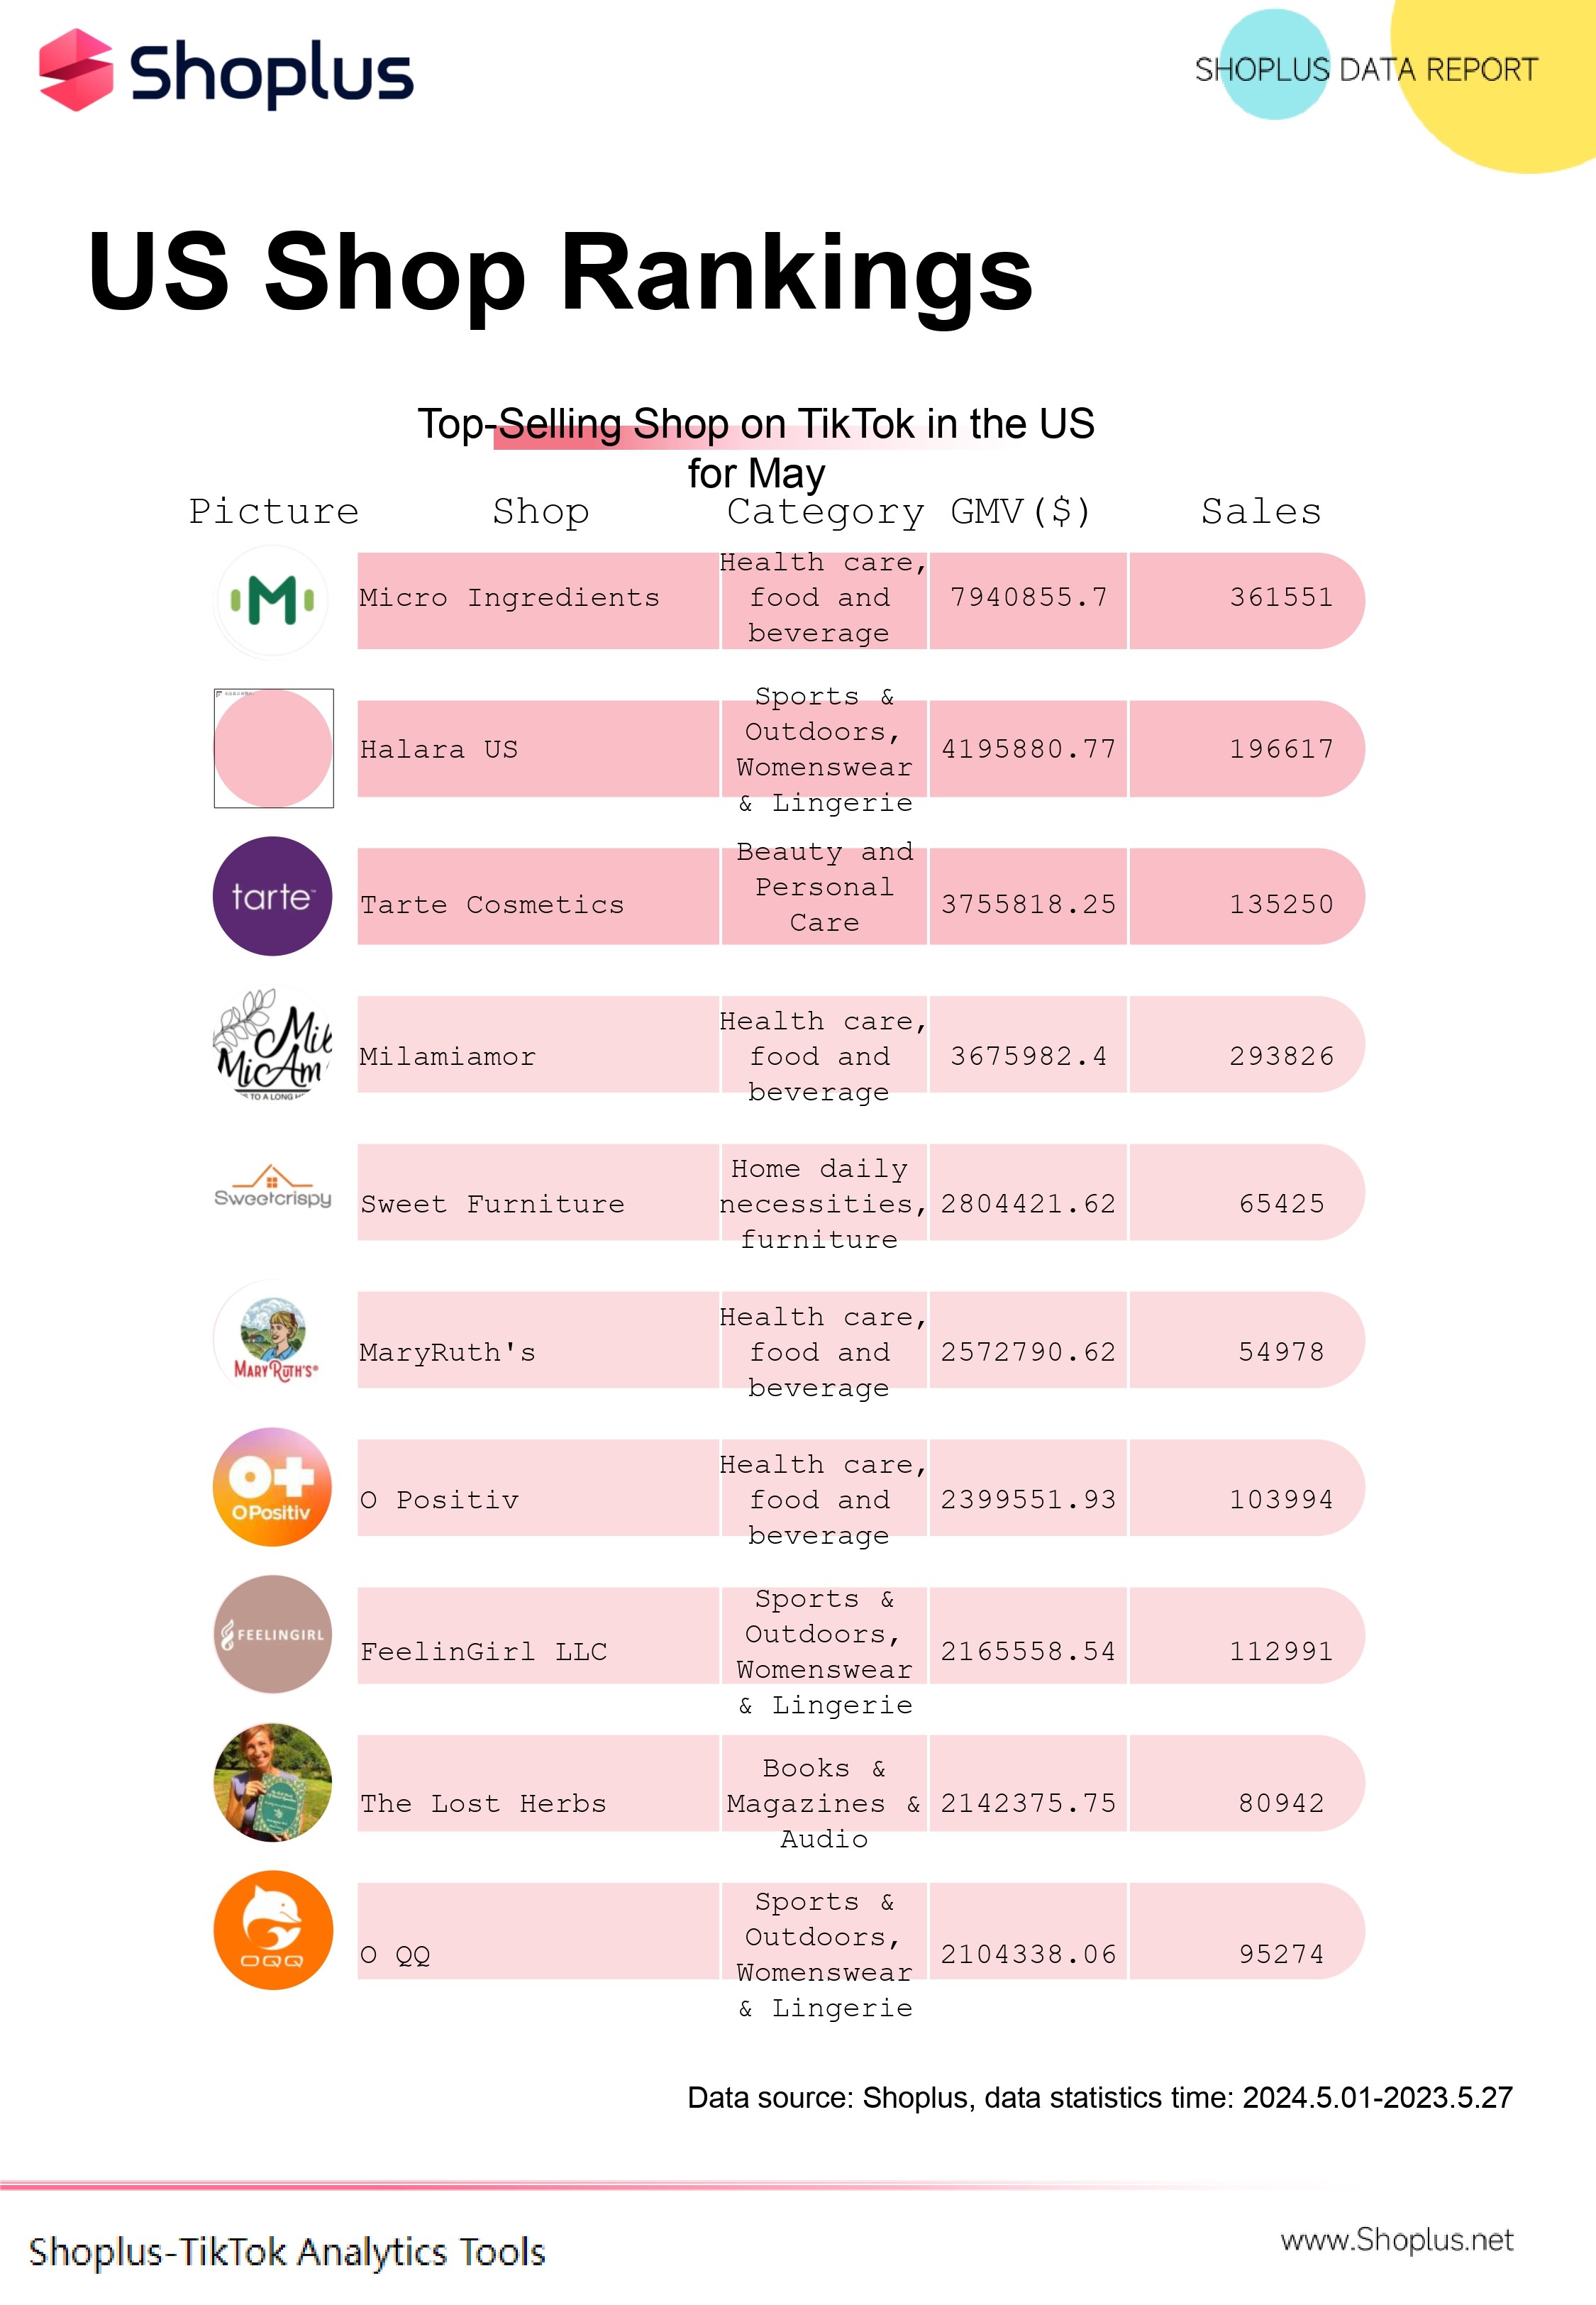
In the small store rankings, Micro Ingredients ranked first with several hot-selling health products, with a total sales volume of 360,000 orders.
Next is the well-known women's sportswear fashion brand Halara, with sales of nearly 200,000. Third is the beauty store Tarte Cosmetics, mainly selling lip glosses, lipsticks, and other products.
Looking at categories, this month also saw the most listings in the health race, with four related stores.
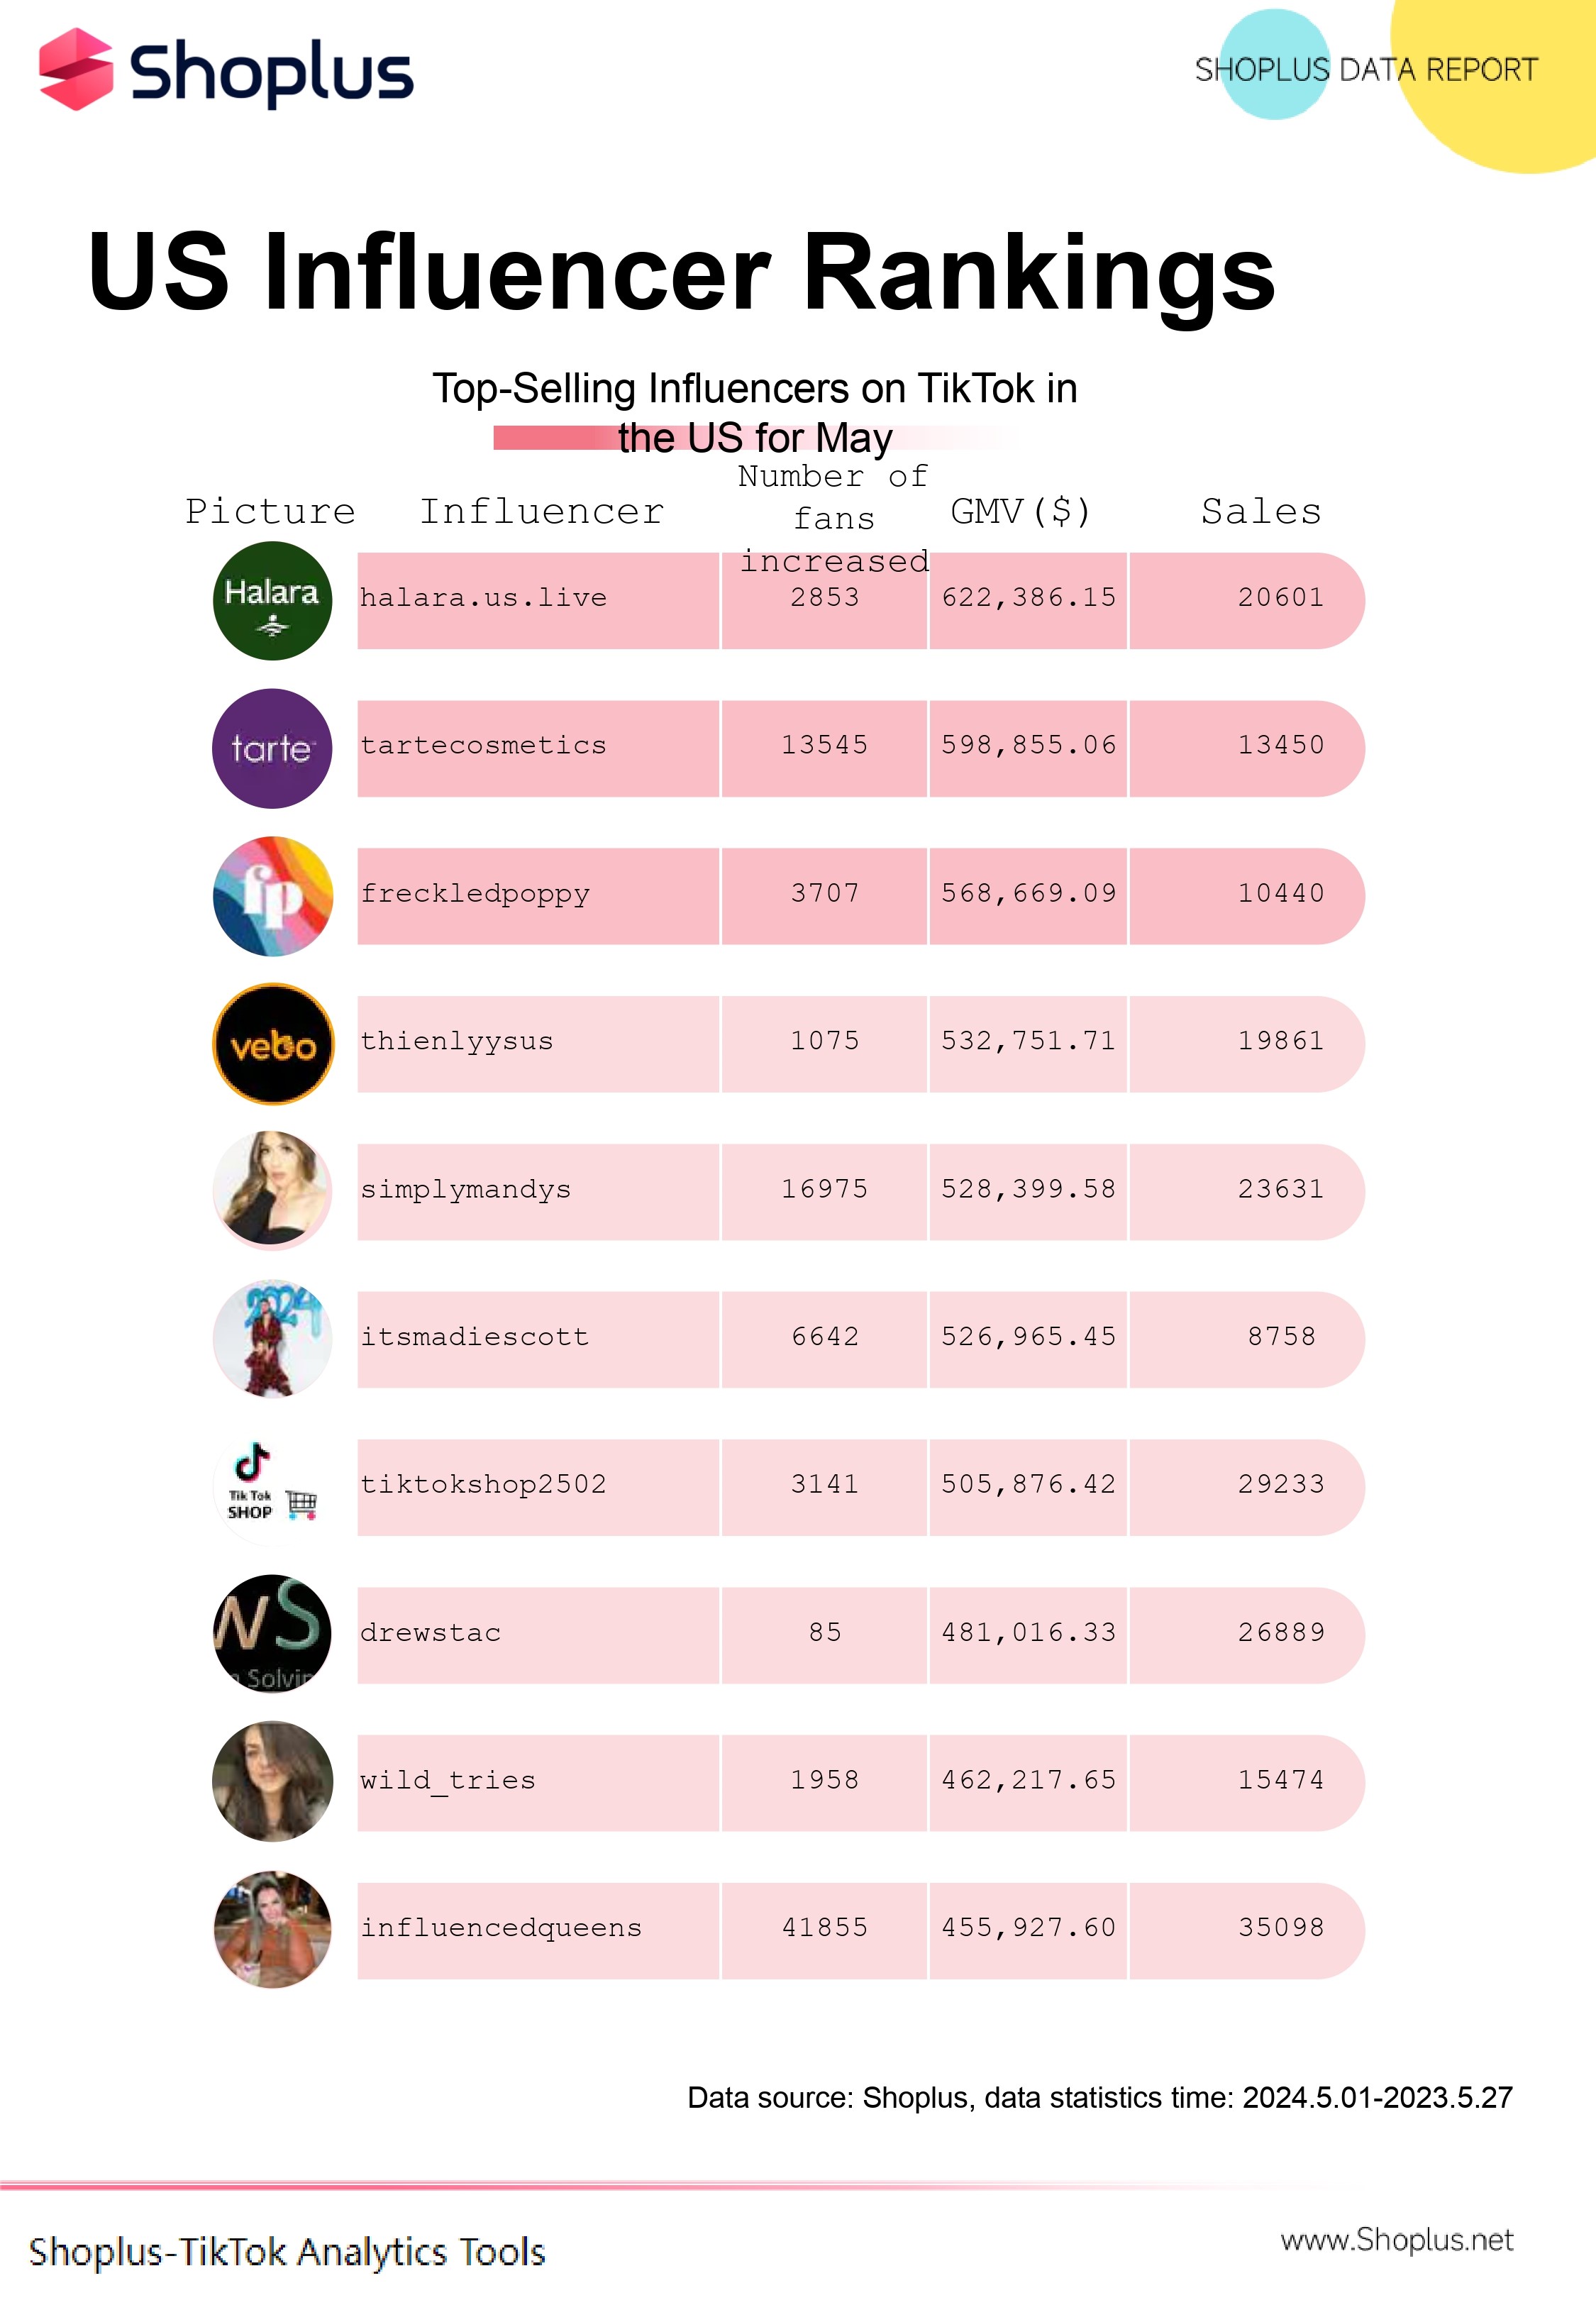
In the influencer sales ranking, Halara's self-operated account ranked first with a GMV of $620,000, followed by Tarte Cosmetics' self-operated account. Third is @freckledpoppy, mainly selling women's clothing.
3. Star Products of the Month
Health products are undoubtedly the star products in the US this month.
Among them, the Top 1 and Top 2 of the monthly sales list are both health products. In terms of products, Top 1 is a health capsule for intestinal health, and Top 2 is a nutritional powder containing various vitamins.
From the perspective of influencer-driven sales, a considerable amount of investment has been made in these types of products in short videos this month, with both products associated with tens of thousands of videos. In addition, the number of live broadcasts for both products is around 3,000, with around 3,000 associated influencers.
In terms of influencer-driven sales, small influencers (10,000-100,000 fans) accounted for 5.14% of collaborations, but they contributed the highest sales and had the best performance, accounting for a high 31.28%.
Conclusion
The latest data on TikTok e-commerce in the US for May demonstrates resilience and growth despite challenges such as the TikTok Ban. While the number of store openings saw a decline, the total sales and revenue soared, indicating a robust market demand. Key categories like beauty and personal care, health, and electronics showed remarkable performance, with live streaming sales particularly shining. Influencers, especially those with moderate-sized followings, played a significant role in driving sales. Overall, the US e-commerce ecosystem on TikTok continues to thrive, promising further expansion and opportunities in the future. For a more comprehensive analysis, you can download the full TikTok report PDF on this page.